
More information on the
Oakland public school report cards
In early 2017, the state of California adopted a new method of evaluating school quality across the state that includes multiple measures of student performance. This new accountability system is composed of two sets of measures - 6 state-specified measures that are common across schools and local educational agencies (LEAs) and 4 local measures that can vary somewhat between schools and LEAs. Each year, the California Department of Education (CDE) gathers the data needed to calculate results for each of the state measures and report the results publicly via the California School Dashboard. It is the results for these common state measures that are used in the Oakland Public School Report Cards, focusing on re-presenting the information in a simple, single-page display for each school.
Click HERE to read the full press release by the California Department of Education for the Fall 2017 release.
Click HERE to watch a short video created by the Alameda County Office of Education on the California School Dashboard.
Click HERE to read the full press release by the California Department of Education for the Fall 2017 release.
Click HERE to watch a short video created by the Alameda County Office of Education on the California School Dashboard.
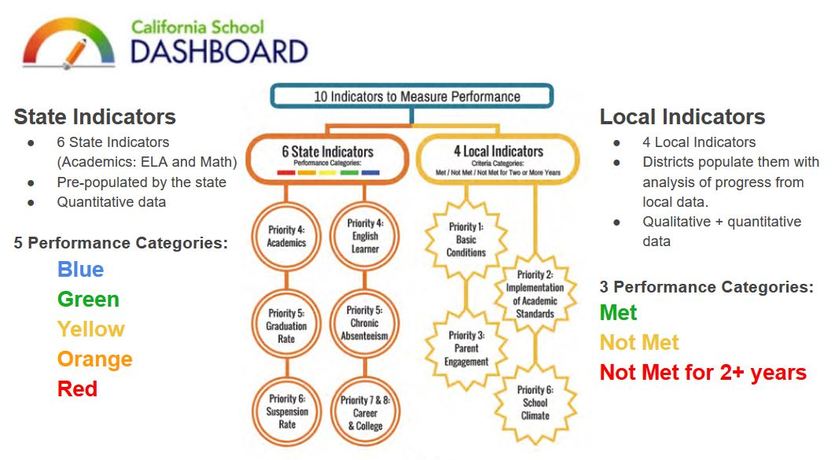
The California School Dashboard has 6 state indicators and 4 local indicators. The state indicators are Academic (ELA and Math), Graduation rate, Suspension rate, English Learner Progress, and College/Career preparedness. The performance categories for the state measures are blue, green, yellow, orange, and red, from high to low performing.
Unlike the state indicators which are calculated by the California Department of Education for all publicly funded schools and districts, the four local indicators are calculated/reported by individual local educational agencies or school districts. The performance levels for the local indicators are met, not met, and not met for two or more years.
What is being measured by the Oakland Public School Report Card?
Each of the measures in the state model captures the status and year over year change in performance of students. Together, the combination of Status and Change results are then translated into a Performance result using a set of cut points that were established separately for each measure. These cut points are based on the distribution of results across all publicly-funded California schools. For Status, results are categorized as "very high", "high", "medium", "low" or "very low". For Change, results are categorized as "significantly increased", "increased", "maintained", "declined", or "significantly declined". For Performance, these 5 levels of status and change are combined using a reference grid to give rise to a final result color of red, orange, yellow, green or blue. Here, blue means that a school performed among the best of all California schools (in terms of status and change combined), and red means that a school performed worse than most of California schools (in terms of status and change combined).
The measures (and relevant gradespans) for which full data are currently available are the Academic Indicator for ELA and Math (3-8), Graduation Rate (9-12), Suspension Rate (K-12), and English Learner Progress (K-12). The two measures for which data are not yet fully available are Chronic Absenteeism and College/Career (9-12). See the descriptions of individual measures below for information on what school year data are available in the current release (see also this infographic or this CDE page).
Academic Indicator - ELA and Math
The academic indicator is actually made up of two separate measures (English Language Arts or ELA and Math) derived from student performance on the standardized state assessment, the Smarter Balanced Assessment Consortium (SBAC) test. Status is calculated as the distance in scale score from the lowest score needed to meet standards (level 3), averaged across students, and change is calculated as the difference in this average distance from level 3 (DF3) between the two most recent years of available data. The results for this indicator are reported separately for ELA and Math and apply only to students in grades 3-8. In the Fall 2017 release, data for status are from the 2016-17 school year and change represents the difference in results from 2015-16. Note that 11th grade SBAC results will contribute to the College and Career indicator rather than the Academic Indicator. Click HERE for more information on the Academic Indicator.
Graduation Rate Indicator
The graduation rate indicator is a measure of the four year cohort graduation rate and the change between this rate and that of the prior three year average. In the Fall 2017 release, data for status are from the 2015-16 school year and change represents the difference in results from the three year average of 2014-15, 2013-14, and 2012-13. The denominator for change is the sum of the cohort students across those three years. Five year cohort graduation rate may be integrated to this measure in 2018. District-wide graduation rate results exclude alternative school data. Click HERE for more information on the Graduation Rate Indicator.
Suspension Rate Indicator
The suspensions indicator measures the rate of suspending students (in and out of school; one student suspended more than once is counted only once) and the change in this rate between the two most recent years of available data. In the Fall 2017 release, data for status are from the 2016-17 school year and change represents the difference in results from 2015-16. Click HERE for more information on the Suspension Rate Indicator.
English Learner Progress Indicator
The English Learner Progress indicator measures the rate at which English Learners (ELs) and students who were reclassified English proficient (R-RFEP in the prior year) make progress toward English Language proficiency. English Learners are included in the numerator for gaining at least one English Language Proficiency Assessment (CELDT or ELPAC) performance level, maintaining Early Advanced or Advanced Proficient status, or reclassification in the prior year. Those long-term English Learners who gained at least one performance level are also counted again in the numerator to emphasize the importance of progress in this student group. In any case, students must have test scores in both the current and prior years to be included. Status is measured using data from 2016-17 and change is measured as the difference in result from 2015-16. Note that if 50% of the EL population in a school were not tested, the EL Progress indicator result for that school is automatically assigned an orange result. Click HERE for more information on the English Learner Progress Indicator.
College/Career Indicator
Full data not yet available. This indicator measures the percentage of students who graduate and complete at least one additional requirement preparing the student for college and career and the change in this rate from one year to the next. As of the Fall 2017 release, only status data are available (status data are from the 2015-16 school year). Click HERE for more information on the College/Career Indicator. See also THIS description from the CDE.
Chronic Absence Indicator
Full data not yet available. This indicator shows the percentage of students who missed 10% or more days of school and the change in this rate from one year to the next. As of the Fall 2017 release, no data are yet available.
Glossary of Terms
ELA - English Language Arts
English Learners - students who are not yet proficient in speaking, reading and writing in the English Language
Socioeconomically disadvantaged/low income - students who fulfill either of the following criteria: neither parent has a high school diploma or the student qualifies for the national free/reduced price lunch program
Result Translation to Color
5x5 reference grids show how performance is translated from the combination of status and change. For some indicators, a single grid can be used in this result translation (like the academic indicator for ELA) regardless of school or LEA type, whereas for others there are a set of reference grids that are relevant only for a given LEA or school type. Note that the reference grids for the Academic ELA and Math measures were changed between the Spring 2017 and Fall 2017 release. Click HERE to view the Spring 2017 reference grids for the Academic Indicator.
Additional resources and CDE-generated reports are available using the links below:
https://caschooldashboard.org/#/resources
http://www.cde.ca.gov/ta/ac/cm/index.asp
http://archive.acoe.org/dashboard/ACOECaliforniaSchoolDashboardInfographicsToolkit.pdf
For comments or questions about the Oakland School Report Cards, please email Kaia Vilberg at [email protected].