Academic Indicator: ELA and Math
The academic indicator(s) is made up of the performance of students on the SBAC ELA (English Language Arts) and Math assessments. This measure is different from the previous way the state measured performance on state standardized assessments. Previously, performance was calculated as the percentage of students who met or exceeded standards. Now, performance is calculated as the average of scores, calibrated to the score needed to meet standards for each grade level. So, unlike before when only those students with scores above the score needed to meet standards were 'counted', now all students' performance contributes to the measure, not just those who met or exceeded standards. This means that schools will get credit for moving student scores anywhere along the scale, not just when they pass the score needed to meet standards.
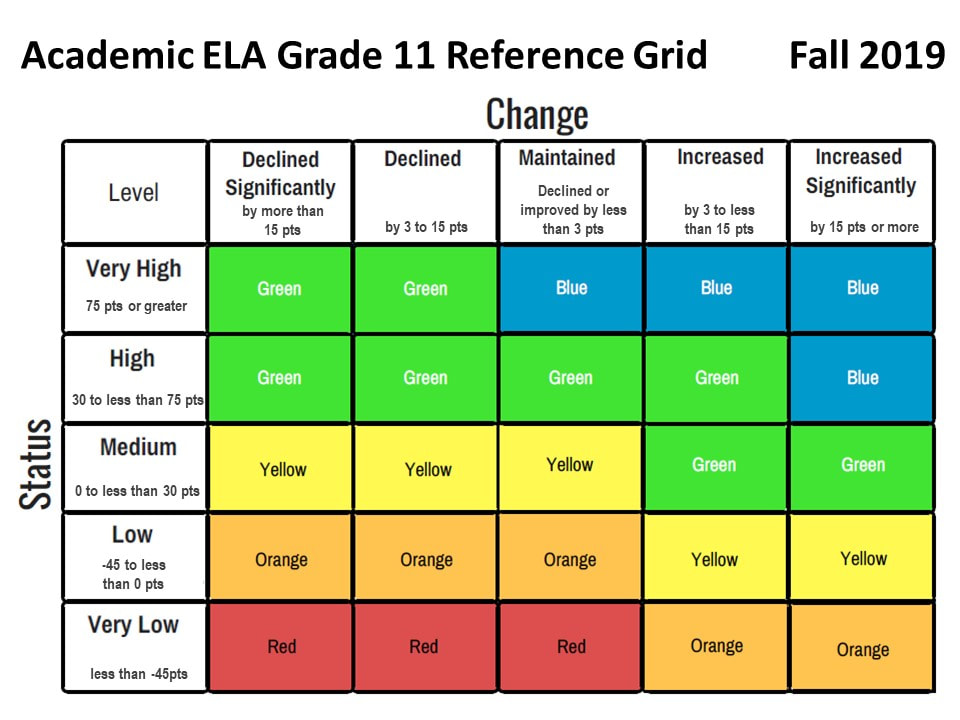
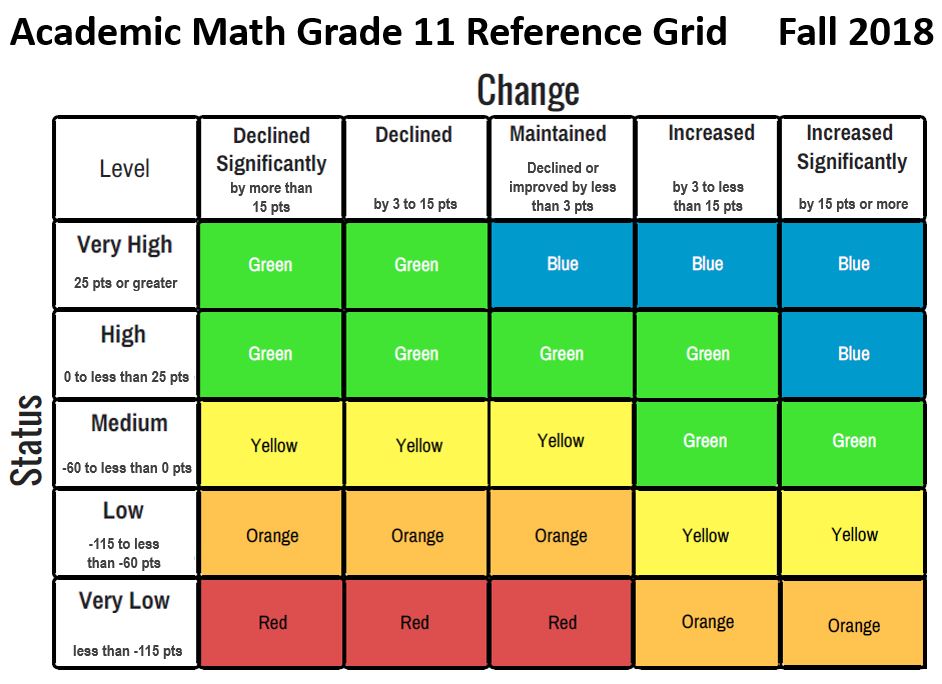
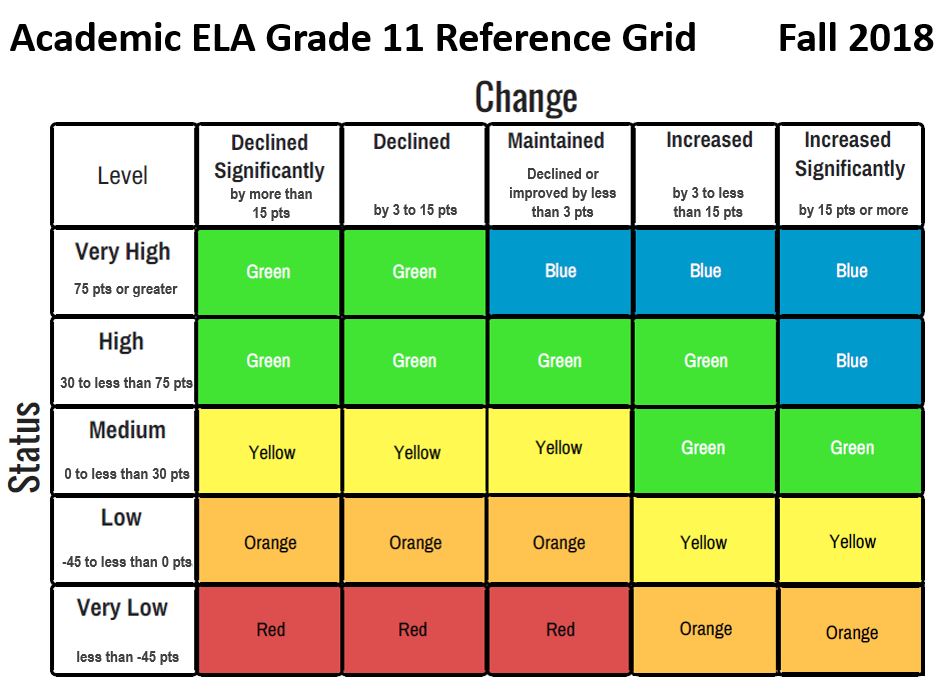
New to the Fall 2018 release was the inclusion of grade 11 results and the adoption of a new reference grid for grade 11 results for determining performance levels. Also new to the fall 2018 release was the application of the 95% participation adjustment (see below). CDE also applied a new "Pair and Share" rule to address the need for an academic indicator result for schools serving students in grades K-2. Here, schools that only serve grade K and 1 students, the state will assign the grade 3 DFS results for the district to that school. For schools that serve grade 2 but not grade 3 students will be assigned the grade 3 DFS result of the school to which the grade 2 students matriculate. Note that these K-2 schools were asked to indicate 'matriculation schools' for their 2nd graders to the CDE. The result for up to three schools is combined in a weighted average based on the % matriculating to each.
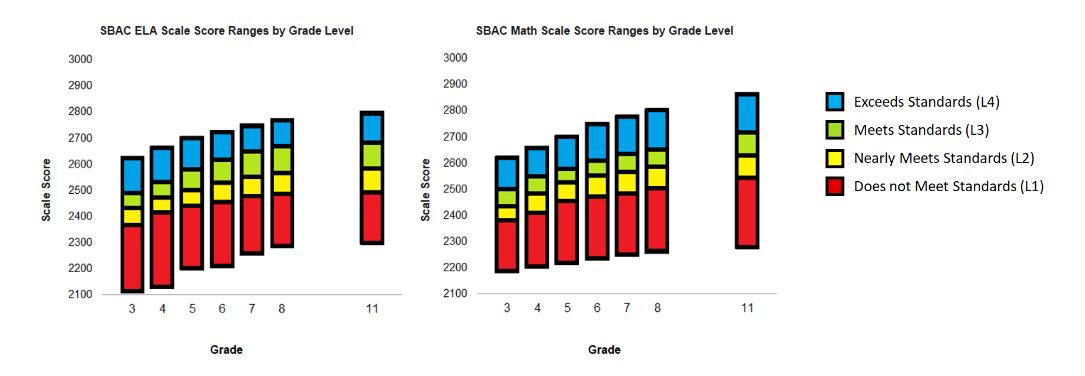
Status is the average scale score distance from meeting standards which is also called DFS. This value is calculated by taking each student's scale score on ELA, and separately, Math, and subtracting it from the scale score needed to meet standards for that grade level. These student DFS results are then averaged across students in a school to get the overall DFS result. This calibration to the scale score needed to meet standards is necessary due to the fact that the range of scale scores possible varies by grade level (see below).
Note that in prior release versions, the abbreviation DF3 was used. This was updated by the CDE for the Fall 2018 release. New to the Fall 2018 release was an adjustment to the DFS score when schools/LEAs test fewer than 95% of their students (per ESSA). If a school/LEA failed to meet this target participation rate in the Fall 2018 release, their DFS score was reduced by a quarter point for each percentage point they were shy of the target. For example, if a school had a DFS of 100 but only tested 85% of students, their DFS would have been adjusted down by (0.25*(0.95-0.85)) = 2.5 points for a DFS result of 100 - 2.5 = 97.5. As of the Fall 2019 release, this same set of rules for adjusting results based on participation rates were applied. All enrolled students who should have been tested on SBAC or CAA are included in determination of participation rate. Participation rates are calculated separately for ELA and Math. Additionally, in the Fall 2019 release, California Alternative Assessment (CAA) results are incorporated using a "top of the scale range approach". This method converts the level result (1, 2, or 3) from CAA into a DFS score by converting the level to an SBAC scale score corresponding to the highest score for that grade level and performance level from CAA, and then converting that to DFS.
For the Fall 2020 release, the rules for adjusting DFS for participation rates below 95% will be updated such that, for every student who should have been tested up to 95% who was not tested, the lowest obtainable scale score (LOSS) will be assigned for that untested student prior to calculating the average. This adjustment has a more negative impact on outcomes than the prior adjustment methodology, as well as for schools and student groups with small N sizes.
Change is the difference in the DFS result between the most recent year of data and the prior year. For Fall 2019, status data uses results from 2018-19 and change is calculated as the difference from the 2017-18 result.
Note that the Academic indicator includes results for students in grades 3-8 and 11. Although the results for 11th graders are included in the College/Career measure, they are also reported separately under the academic indicator to accommodate Federal Every Student Succeeds Act (ESSA) requirements. Also note that for this measure in the Fall 2018 release, English Learner (EL) students included all English Learners plus any students who were reclassified within 4 years of the testing date. This means that schools got credit for the performance of their recently reclassified English Learners. As of the Fall 2019 release, reclassified English Learners are not included in the English learner group. Newcomers who have been in the US for less than a year are not required to take SBAC and are not included in the Academic Indicator calculations.
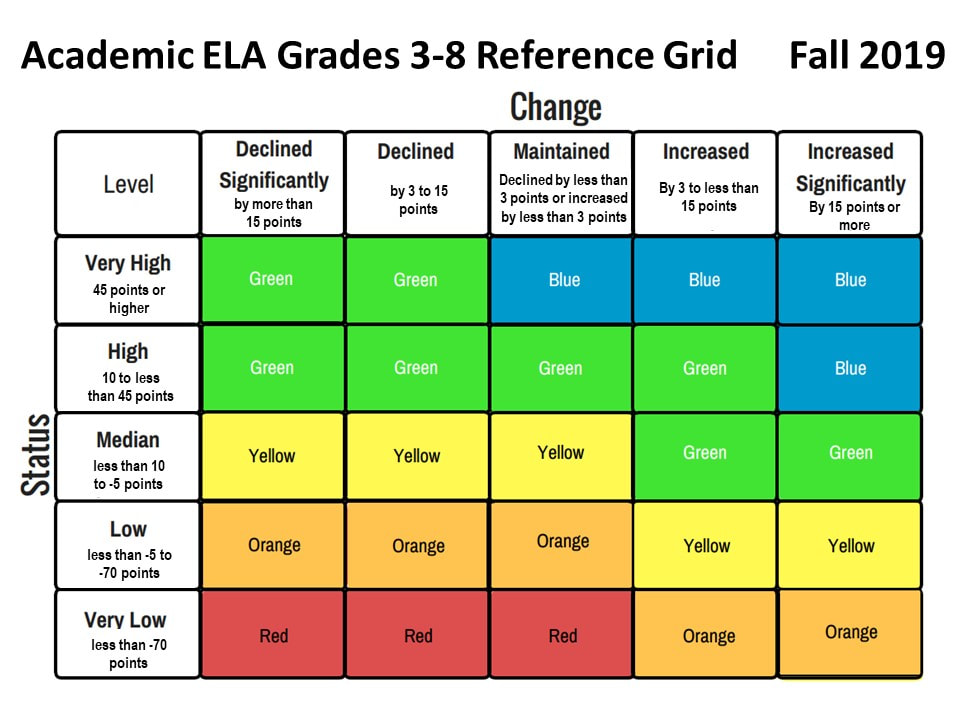
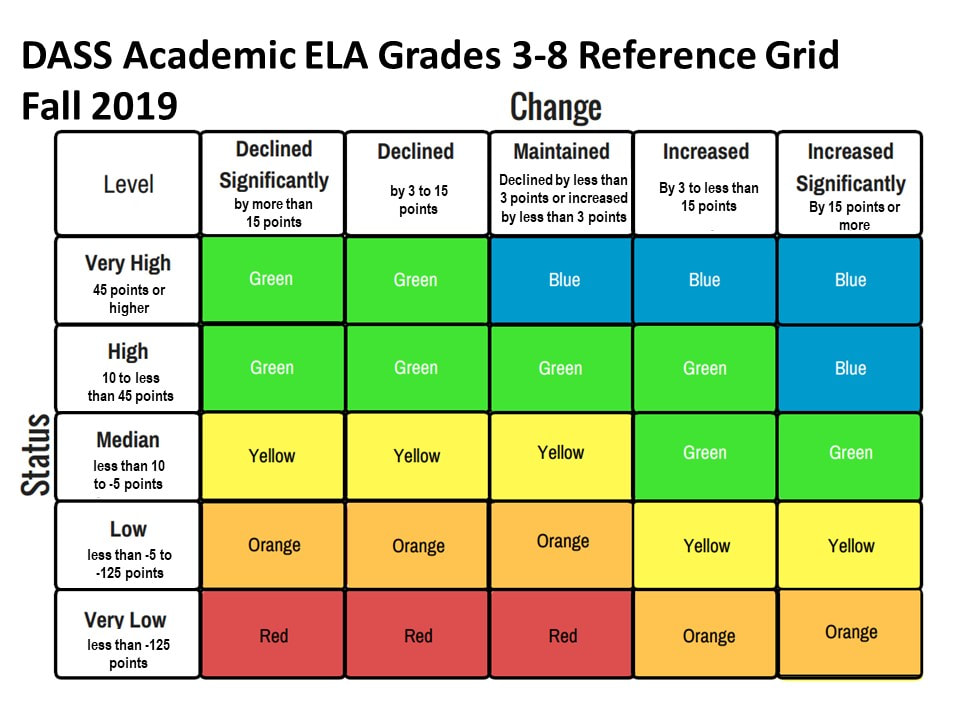
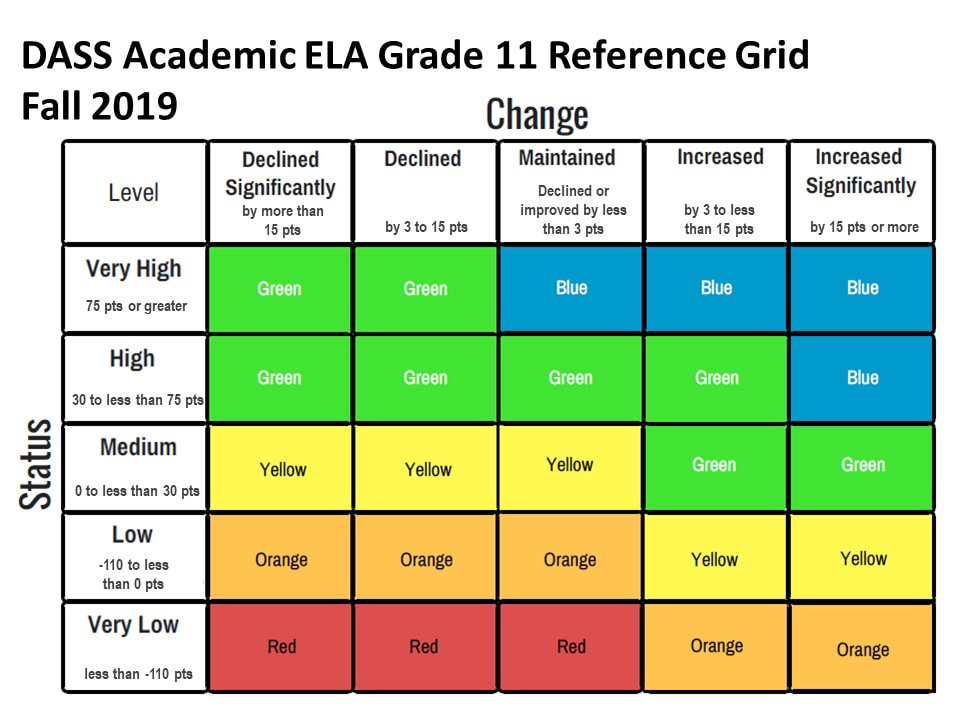
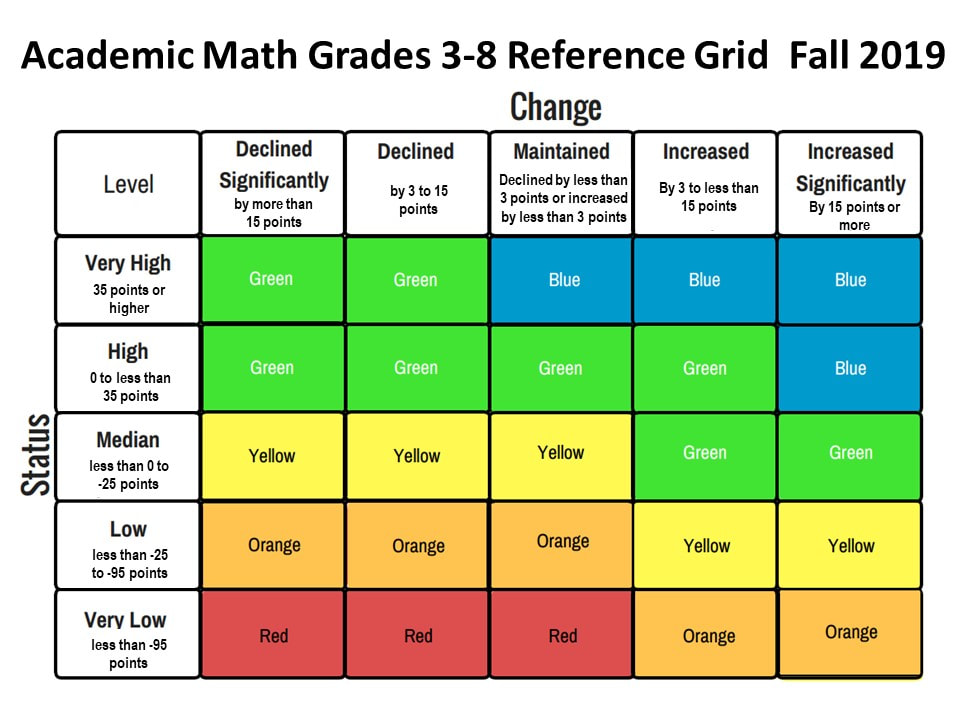
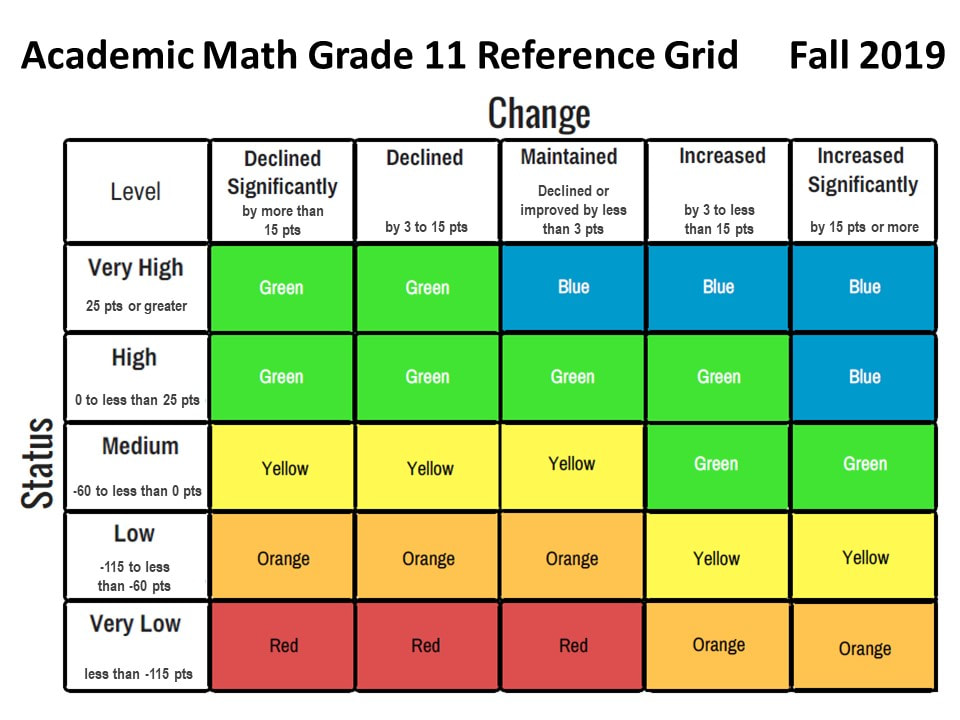
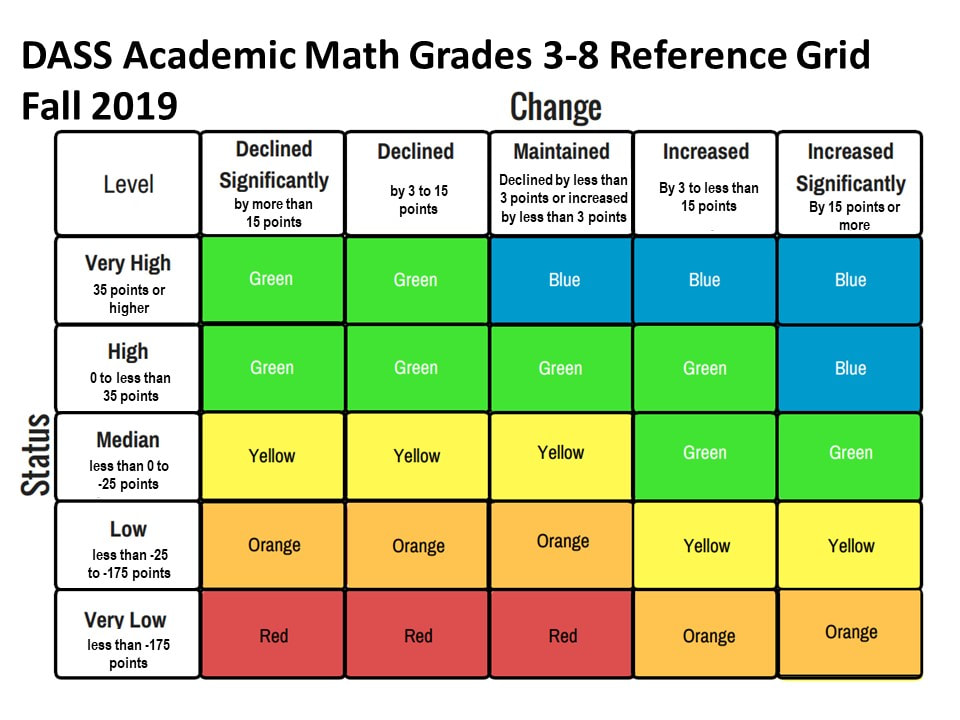
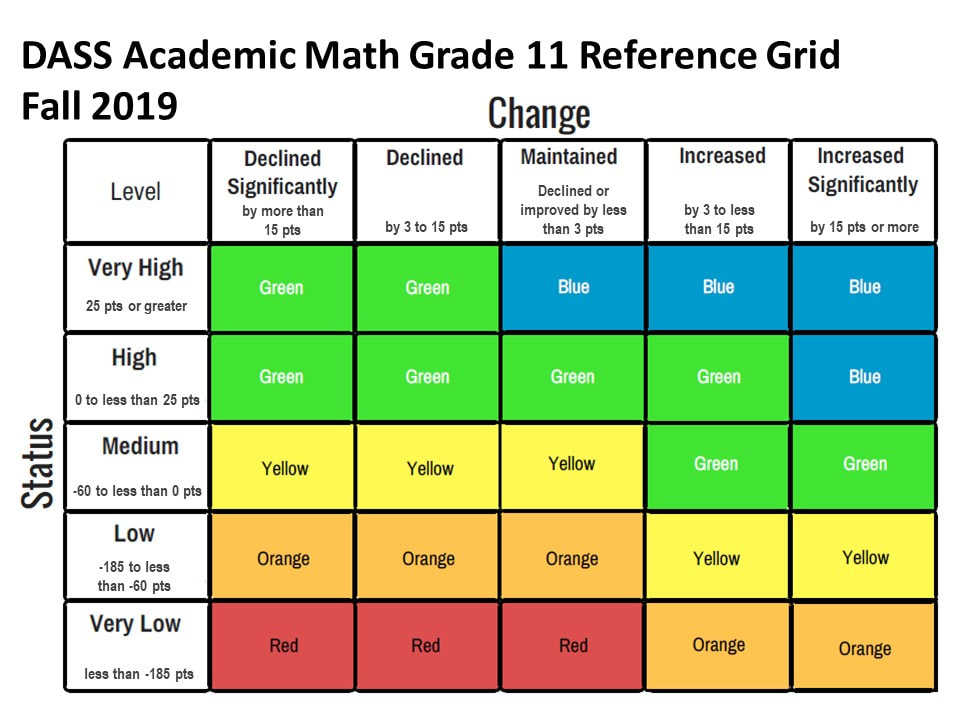
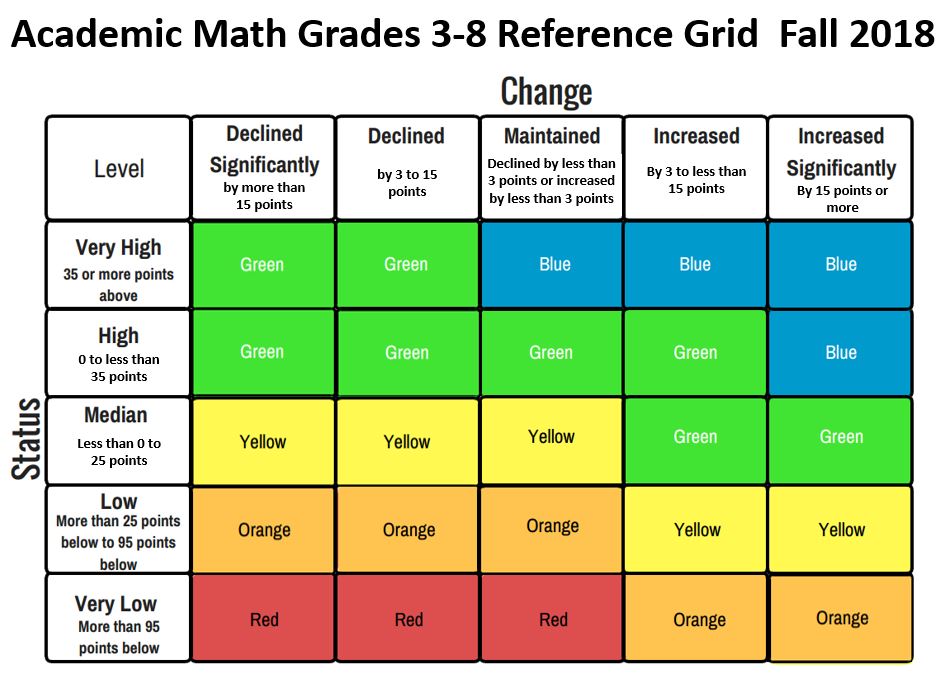
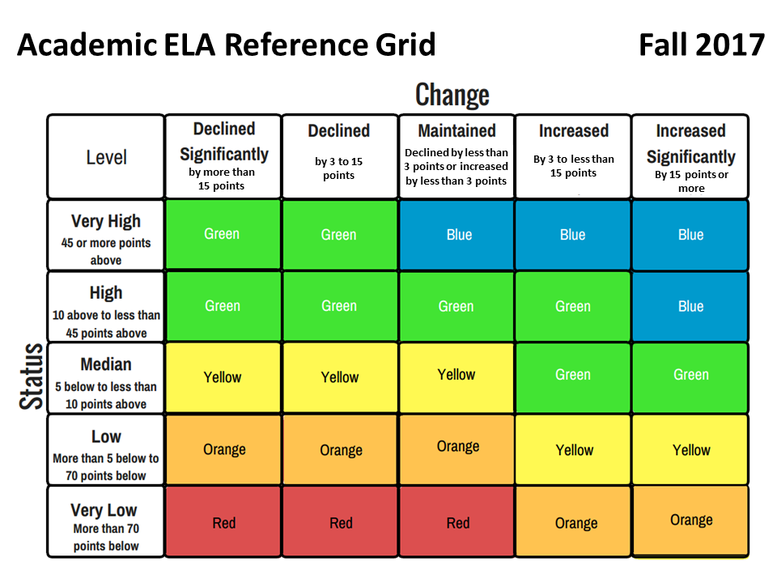
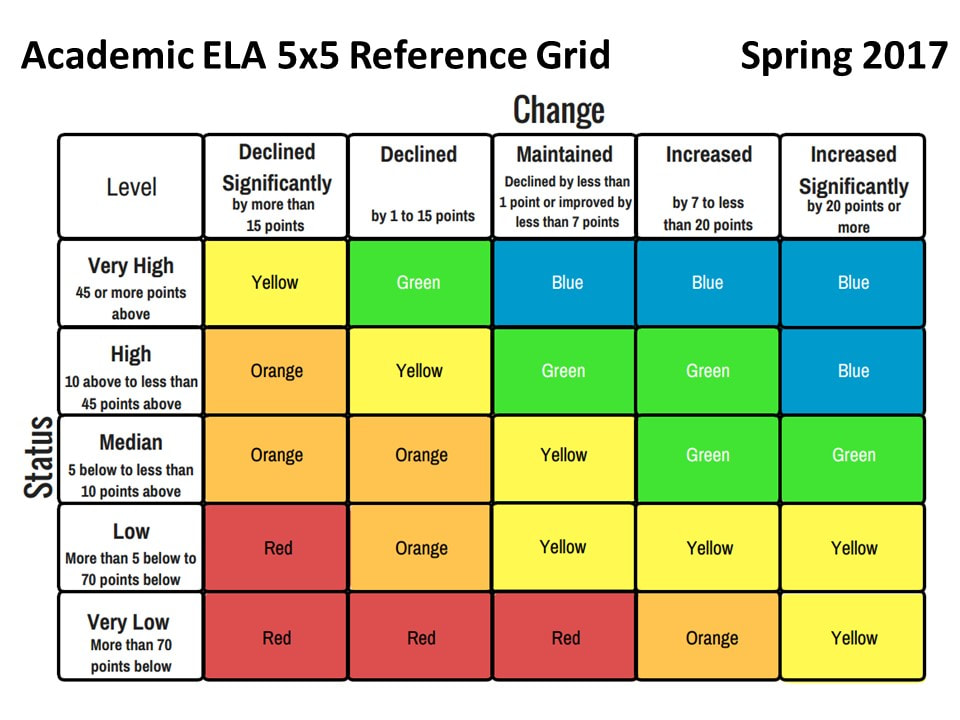
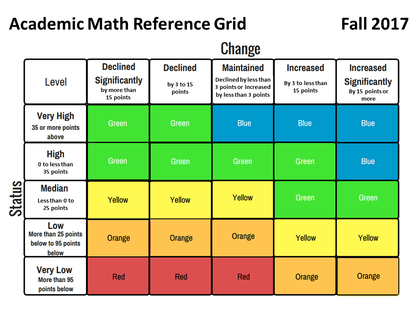
In November 2017, the State Board of Education approved a new set of cut points or reference grids for grades 3-8 ELA and Math due to large shifts in the distribution of results on the Academic Indicator across Local Educational Agencies between the Spring 2017 and Fall 2017 release dates for the California School Dashboard. The Fall 2017 reference grids are based on two years of results, and should result in fewer large swings in the assignment of color performance levels to schools/districts across future releases. New reference grids were adopted in November 2018 for grade 11 ELA and Math results in the Fall 2018 dashboard. These new reference grids apply only to grade 11. The reference grids used in the Fall 2017 release for grades 3-8 remain in effect for those grades in the Fall 2018 release. New reference grids were created for DASS schools for the Fall 2019 release.
Note that any students with disabilities, regardless of where they are receiving services (NPS, private, another district) will be included in the academic indicator for the district of residence. For non-academic indicators, these students' results will be included for the LEA and school at which the student receives services, not the district of residence.
Click HERE to view all reference grids for all of the measures that go into the Fall 2019 California School Dashboard and Oakland Public School Report Cards.
Note that the CDE released an updated dataset for SBAC ELA in April 2020 to correct a scoring error on a subset of 6th grade questions.
Below, the Academic Indicator reference grids for the current and prior releases are shown.

