
Attendance & Chronic Absence
These dashboards are grouped into 3 areas: Cumulative Year-To-Date Attendance: Computations on attendance from the beginning of the year up to the most recent date available, Non-Cumulative Daily and Weekly Attendance: Summations of attendance for students and elementary classrooms for each school day and school week separately, Attendance Accounting and Compliance: Summations on compliance with state requirements around reporting daily attendance in the classroom.
Cumulative Year-to-date attendance
|
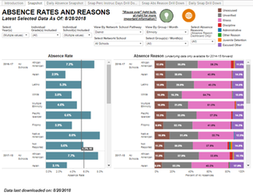
Absence AnalysisDescription: Summations of all-day absences by reason and as a percent of all possible student instructional days.
Inquiry Examples: Which schools have the highest and lowest percentage of lost instructional days? Which school has the high rates of absence for illness? For unverified and unexcused ? Which days and times of the year are absences at their highest? For what reasons? |

|
Chronic AbsenceDescription: The Chronic Absence dashboard shows 4 years of data for students who have satisfactory attendance, or are at risk, moderately or severely chronically absent.
Inquiry Examples: What percentage of selected ethnic groups are chronic absent? At risk? Which schools have the highest and lowest rates of chronic absence? Where in Oakland do a school’s chronic absent students live? |
|
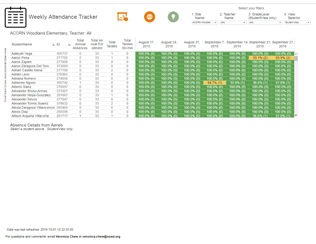
Cumulative Year-To- Date Weekly Attendance TrackerDescription: Weekly attendance rates at the student and classroom level are displayed. This dashboard is ideal for case managers and site-based attendance teams who provide attendance related interventions.
Inquiry Examples: How have attendance rates changed week by week for a student or classroom? Which students at my school have the best or the worst attendance rates as of a certain week? |
|
Period attendanceDescription: Percent of scheduled periods absent and percent of attended periods partially missed due to tardies by Year, School, Date, Month, Reason, Period, Teacher, and Course.
Inquiry Examples: Which teacher and/or course are the best attended and worst attended? What courses are “cut” the most (unverified/ unexcused absences)? Which periods struggle the most with attendance? |
Non-Cumulative daily and weekly attendance
|
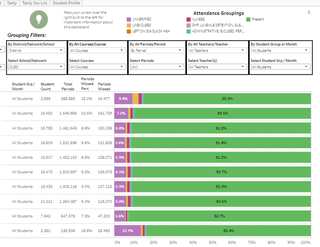
Daily Attendance CalendarDescription: Calendar view of the selected student's school attendance in a print-friendly view for conversations with families.
Inquiry Examples: What attendance report can I bring to SART meetings with students and families? What day of the week does a certain student tend to miss? |
|
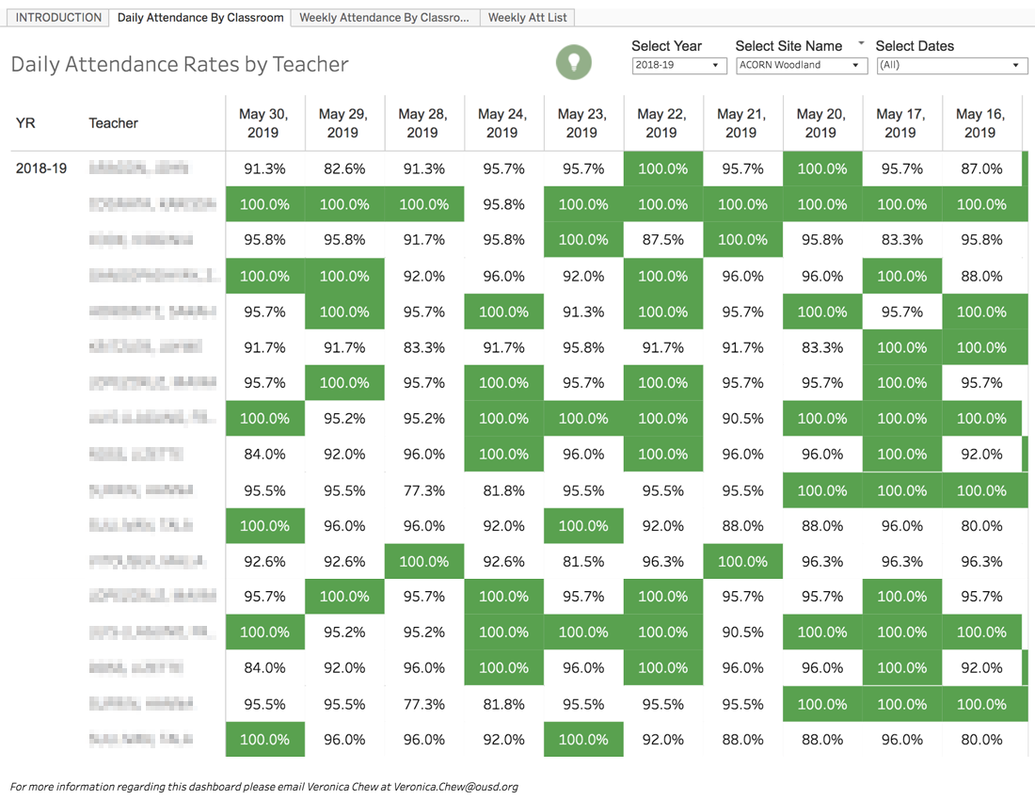
Daily and Weekly Classroom AttendanceDescription: Summations of all-day attendance by school day and calendar week for TK-5 classrooms.
Inquiry Examples: Which classroom had the best attendance for the latest week at your school? What classroom had the most 100% attended days during a custom time period? Which students were absent in a particular week from the classroom? |
Attendance Accounting and Compliance
|
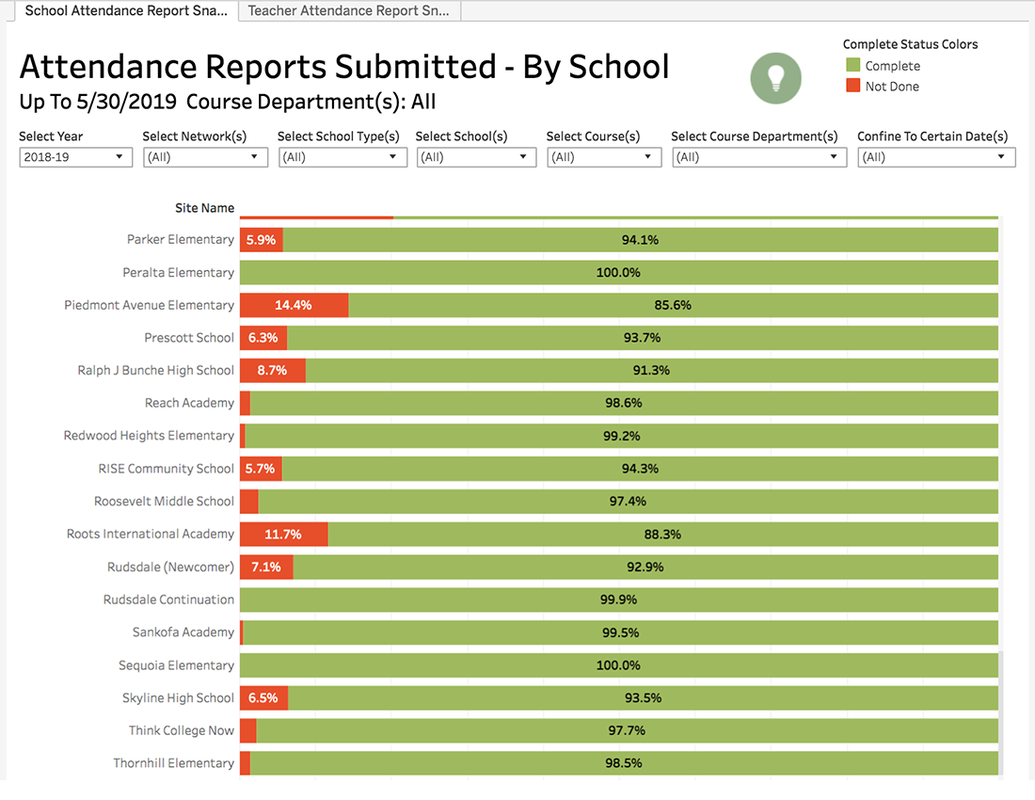
Attendance Report SubmissionsDescription: Submissions of daily attendance reports in AERIES by school and teacher and period and department.
Inquiry Examples: Which teachers have submitted 100% of their expected attendance reports in AERIES? Which schools are doing the best and which schools are doing the worst in regards to submitting attendance reports in AERIES? |
|
Attendance InterventionsDescription: Monitor which high-absence students have received an attendance intervention, when the latest took place, and those who still need one. Keep track of all attendance interventions each student has received and their attendance before and after each intervention date.
|