Suspension Rate INdicator
The Suspension Rate Indicator measures the percentage of students who are suspended in or out of school for one or more days in a given year.
Status is measured as the percentage of students who received a full day of in or out of school suspension.
Change is measured as the difference in the result between the most recent year of data and the prior year of data.
Status is measured as the percentage of students who received a full day of in or out of school suspension.
Change is measured as the difference in the result between the most recent year of data and the prior year of data.
All students enrolled for at least one day at a school are included in the measure. In the Fall 2018 release, only full day suspensions were included. In the Fall 2019 release, however, students who were suspended for partial days that sum to one or more days are also included. The minimum N size for all student groups except foster and homeless students at the school level is 30 students. For these two groups, however, at the LEA level, the minimum N is 15 students. Charter schools are treated as schools rather than LEAs in terms of how the N rule is applied for this indicator. Data for Fall 2019 reports are sourced from the EOY CALPADS submission, extracted on September 6, 2019 with discipline action codes of 100 (out of school suspension) and 110 (in school suspension). Schools that do not submit suspension data in CALPADS in either the prior or current year are assigned an orange performance level, and schools/LEAs that do not certify their data for this indicator cannot receive a level higher than orange.
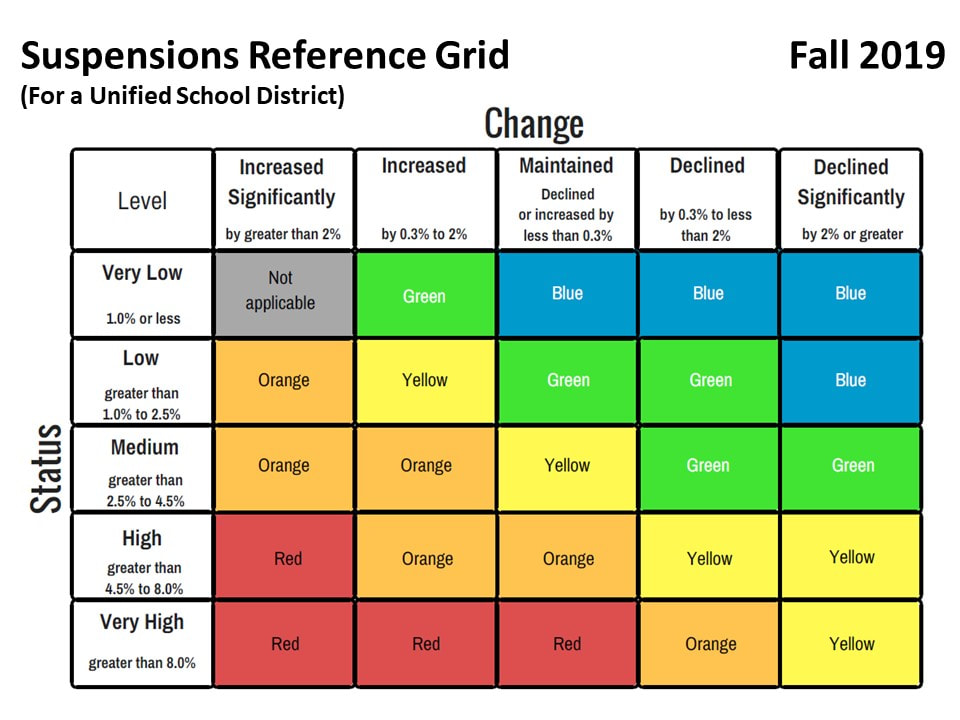
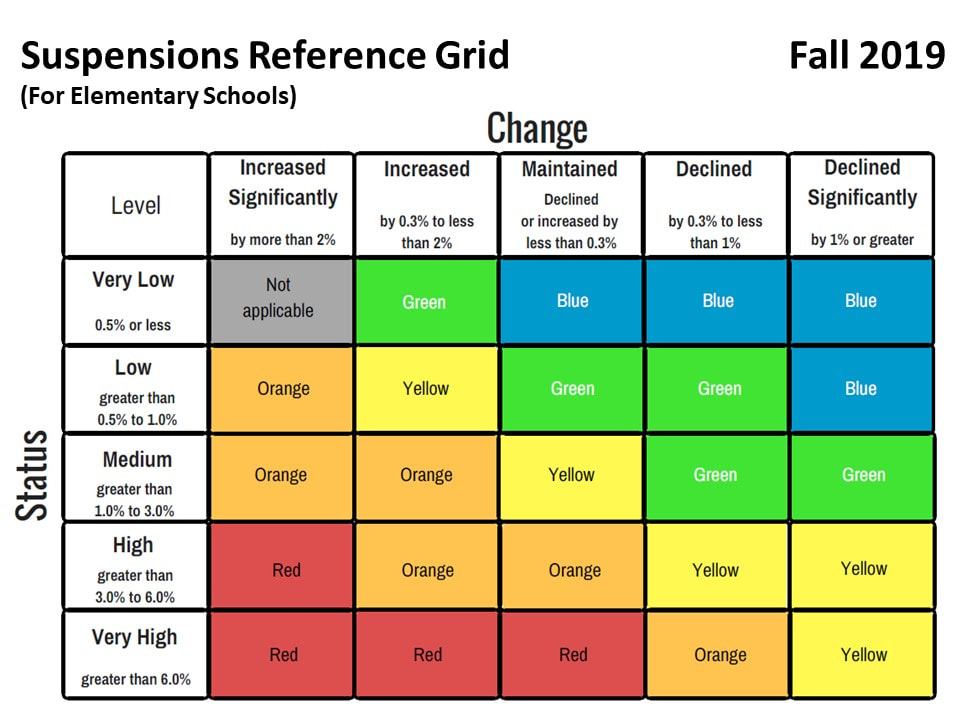
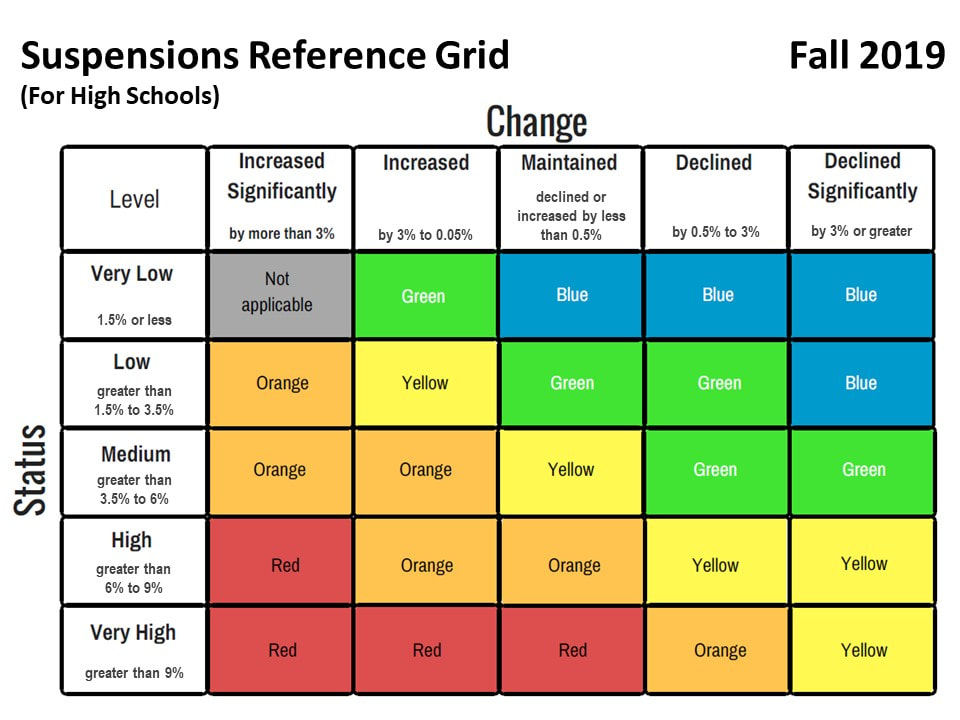
Because the distributions of suspension results vary with the grade level of students, the State Board of Education approved the use of separate reference grids for the Suspension Rate Indicator for Unified School Districts, elementary schools, middle schools, and high schools.
The reference grids for translating status and change results for the Suspension Rate Indicator are below. Click HERE to view all reference grids for all of the measures that go into the California School Dashboard and Oakland Public School Report Cards.
Safety Net Methodology
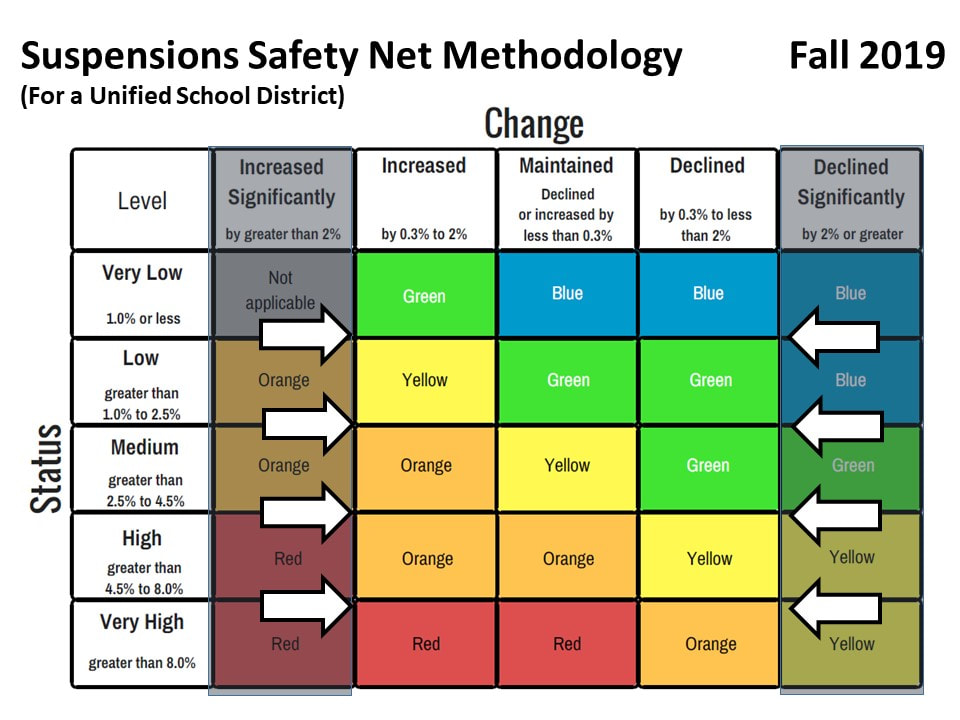
For both Graduation Rate and Suspension Rate, the State Board of Education approved the use of what they are calling the safety net methodology to prevent large swings in results for these measures triggered by the results of just a few students. The methodology is applied when the N size is less than 150 students for that measure. What this methodology does is remove the possibility of classification of results into the increased significantly or declined significantly columns from the reference grids. If the change result for a Unified School District (see below) for suspension rates is a decrease of more than 2 percentage points but there are fewer than 150 students in the cohort, then their result will be translated to color using the "Declined" change column. Likewise, if the change result for a district is an increase of more than 2 percentage points but there are fewer than 150 students in the cohort, then their result will be translated to color using the "Increased" column. Note that the reference grid safety net methodology below is depicted for a Unified School District but the same methodology applies for Elementary, Middle, and High School Suspension Rate reference grids.
For both Graduation Rate and Suspension Rate, the State Board of Education approved the use of what they are calling the safety net methodology to prevent large swings in results for these measures triggered by the results of just a few students. The methodology is applied when the N size is less than 150 students for that measure. What this methodology does is remove the possibility of classification of results into the increased significantly or declined significantly columns from the reference grids. If the change result for a Unified School District (see below) for suspension rates is a decrease of more than 2 percentage points but there are fewer than 150 students in the cohort, then their result will be translated to color using the "Declined" change column. Likewise, if the change result for a district is an increase of more than 2 percentage points but there are fewer than 150 students in the cohort, then their result will be translated to color using the "Increased" column. Note that the reference grid safety net methodology below is depicted for a Unified School District but the same methodology applies for Elementary, Middle, and High School Suspension Rate reference grids.


