Department of Research, Assessment & Data
OUSD Data
  • Data
  • Resources
  • Requests
  • Announcements
  • About Us
    • Staff

SUSPENSION INCIDENTS DASHBOARD ENHANCEMENT!

11/22/2016

0 Comments

 
Picture
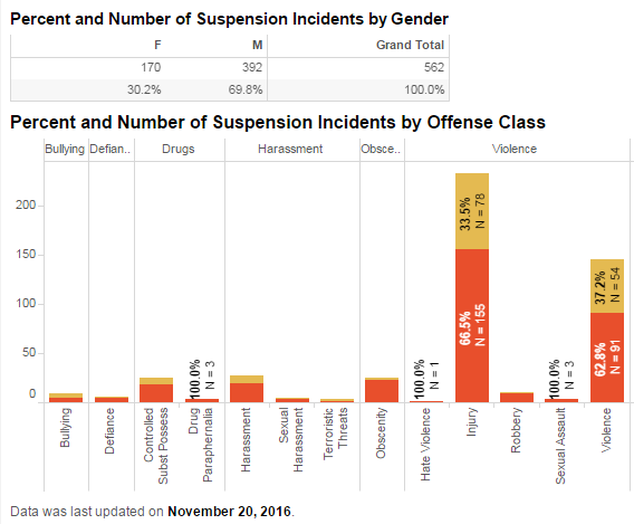
For OUSD Staff: The Suspension Incidents interactive dashboard has been enhanced to ease identification of suspendable offenses. Several offenses that had been classified as "Other" have been moved into a new "Harrassment" offense group.  

The 'Snapshot' chart allows users to tally suspensions by exact Offense as well as by Offense Group. For questions about the dashboard, please contact: Jay Tharp, RAD, [email protected]. For questions about OUSD suspension and discipline practices, please contact: Theresa Clincy, Coordinator, Attendance and Discipline Support Services, [email protected].
0 Comments

On-Track to Graduate Student Profile Now Available!

11/8/2016

0 Comments

 
Picture

​For OUSD Staff: A new dashboard has been created to help monitor student progress toward meeting OUSD Graduation and UC/CSU requirements. This dashboard includes details on all A-G course work in order to track credits earned in individual subject areas. This is not an official transcript, but is intended to be a tool assist school counselors and leadership to keep students on-track to meeting graduation requirements.

For questions about this tool, please contact Kevin Schmidke at [email protected].
0 Comments

CST / CMA / CAPA   SCIENCE  RESULTS  NOW  AVAILABLE !

11/3/2016

0 Comments

 
Picture
For OUSD Staff: ​Spring 2016 was the final administration of CST/CMA/CAPA Science assessments for students in grades 5, 8, and 10.  Nearly 7000 students participated.  

In Spring 2017, our students will participate in pilot testing of assessments based on NGSS standards. Results from 2015 and 2016 are available in the CAASPP Science interactive dashboard. 

For questions about this dashboard, please contact Jay Tharp at [email protected]
0 Comments

School Performance Framework: 

11/1/2016

0 Comments

 
Picture
For OUSD Staff: Two dashboards have been created to show how sites in OUSD performed on each of the measures of the SPF in a district-wide overview.

SPF Status Dashboard - shows histograms of the performance of the all students group across schools for each of the SPF measures. 

SPF Cross-Sectional Growth Dashboard - shows histograms of the annual change in performance of the all students group across schools for each of the SPF measures. This dashboard shows how much progress sites have made in their results from the 2015 SPF release. 

For questions about this dashboard, please contact Kaia Vilberg at [email protected].
0 Comments

MATH INVENTORY (SMI) FALL ASSESSMENT RESULTS DASHBOARD IS AVAILABLE!

11/1/2016

1 Comment

 
Picture
For OUSD Staff: the Scholastic Math Inventory (SMI) dashboard is now up-to-date with Fall 2016 results through October 28.  Districtwide, the participation rate was 84%.  Test takers include all grades 3-8 students and students enrolled in Algebra 1.  Exempt students were those enrolled in either a Moderate/Severe Handicapped (L2) Math course, a web-based APEX Algebra 1 course, or math instruction through the Home & Hospital program.  Also exempted were students at Urban Promise Academy (UPA), where the NWEA MAP assessment is used in lieu of the SMI assessment.

16% of students scored "Grade Level Ready" or "Above Grade Level Readiness".  For comparison, last year at this time only 12% of students scored as well.

For questions about this dashboard, please contact Kevin Smith at [email protected].
1 Comment

    Archives

    July 2024
    August 2023
    May 2022
    January 2022
    June 2021
    May 2021
    April 2021
    March 2021
    February 2021
    January 2021
    December 2020
    November 2020
    October 2020
    September 2020
    August 2020
    June 2020
    March 2020
    February 2020
    January 2020
    December 2019
    November 2019
    October 2019
    September 2019
    August 2019
    May 2019
    April 2019
    March 2019
    February 2019
    January 2019
    December 2018
    November 2018
    October 2018
    September 2018
    August 2018
    July 2018
    June 2018
    May 2018
    April 2018
    March 2018
    February 2018
    January 2018
    December 2017
    November 2017
    October 2017
    September 2017
    August 2017
    July 2017
    May 2017
    April 2017
    March 2017
    February 2017
    December 2016
    November 2016
    October 2016
    September 2016
    August 2016
    June 2016
    May 2016
    April 2016
    March 2016
    February 2016
    January 2016
    December 2015
    October 2015
    September 2015
    August 2015
    July 2015
    June 2015
    May 2015
    April 2015
    March 2015
    February 2015
    January 2015
    December 2014
    October 2014
    September 2014
    August 2014

    Categories

    All
    Accountability
    Advance Placement
    Asset Management
    Attendance
    CAASPP
    Calendar
    California Healthy Kids Survey
    CHKS
    Chronic Absence
    College
    CORE
    CSDR
    CST CMA
    DIBELS
    Disproportionality
    Dropout
    EAP
    Early Development Instrument
    Early Literacy
    Early Warning
    EDI
    English Language Learner
    Enrollment
    F&P
    GPA
    Graduation
    Guides
    High School
    IAB
    Infographic
    I-Ready
    Linked Learning
    Maps
    Math
    McKinney-Vento
    Multilingual
    Newcomer
    Newsletter
    Office Referral
    Partnerships
    Pathway
    Physical Fitness Test
    Post Secondary Readiness
    Preschool
    Programs
    PSAT
    Public
    SBAC
    Scholastic Math Inventory
    Scholastic Reading Inventory
    Science
    Staff Data
    State Testing
    Student Level
    Summer
    Survey
    Suspension
    Technology
    Weekly Engagement Report

    RSS Feed