|
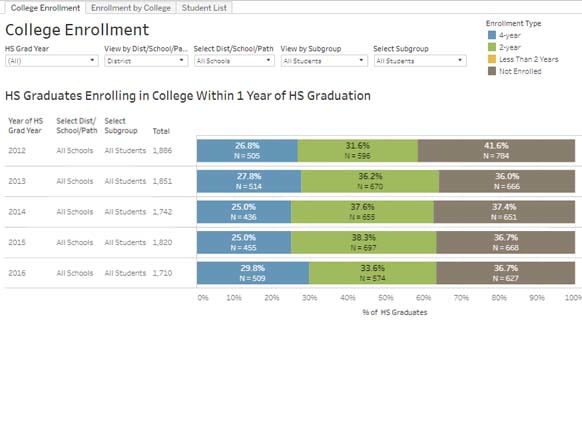
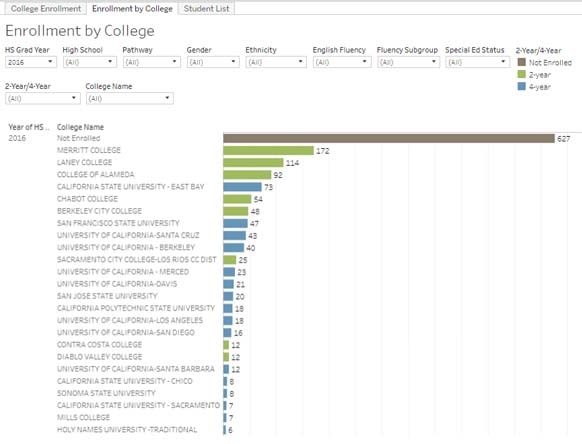
For OUSD Staff: this dashboard is based on National Student Clearinghouse data and shows the percent of OUSD graduates that enrolled in college within one year of graduating high school. The data is broken down by 2 year and 4 year college and can be viewed by graduating high school, pathway enrollment, and subgroup. The second tab allows the user to see how many students enrolled in college by specific college name. For any questions or comments, please contact Kevin Schmidke at [email protected].
0 Comments
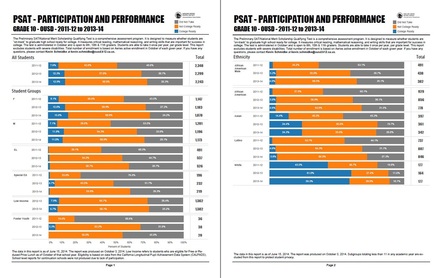
PSAT 10th Grade Participation and Performance reports are now available at the district and school level in our Internal Data Reports page. The Preliminary SAT/National Merit Scholarship Qualifying Test is a comprehensive assessment program. It is designed to measure whether students are
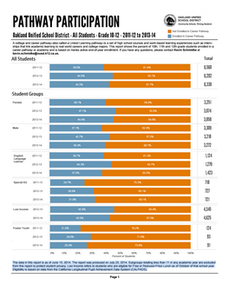
"on-track" to graduate high school ready for college. All 10th grade OUSD students take the exam free of charge in October and results are received from the College Board. Enrollment is based on October Aeries enrollment. If you have any questions, please contact Kevin Schmidke for more information.  A college and career pathway - also called a Linked Learning pathway - is a set of high school courses and work-based learning experiences such as internships that link academic learning to real world careers and college majors. You can access Oakland Unified School District's Grade 10-12 Pathway Participation 2013-14 reports in our Public Data Reports page. Reports are available at both the district and school level. Enrollment is based on Aeries active end of year enrollment. The data is as of June 15, 2014. The report was produced on July 25, 2014. Subgroups totalling less than 11 in any academic year are excluded from this report to protect student privacy. For questions about these reports, please contact Kevin Schmidke. College Enrollment reports are now available on the Data Team’s Google Drive. These reports show the percent of graduates enrolling in 2 or 4 year colleges within 16 months of graduation. Five years of data are included from 2008-09 through 2012-13. Due to the timing of the data collection, data for the 2012-13 graduates only includes enrollments within 8 months of graduation as opposed to 16 months for prior years. Reports are available in PDF format for individual schools and the district overall.
For questions about this report, please contact Kevin Schmidke. AP Exam Performance reports are now available on the Data Team’s Google Drive and include the past 5 years of data through 2013-14. These reports show the percent of students in grades 10-12 who have participated in at least 1 AP exam and additionally how many of those students passed the exam with a score of 3 or higher. Passing the AP exam with a score of 3 or higher indicates that a student is “qualified” to receive college credit. Reports are available in PDF format for individual schools and the district overall. Reports were not produced for schools with low participation.
For questions about this report, please contact Kevin Schmidke.  The 2013-14 PSAT results reports are now available on the Data Team’s Google Drive. The reports compare 2011-12, 2012-13 and 2013-14 grade 10 PSAT performance. The PSAT results are used as an early indicator of college readiness. Reports are available in PDF format for individual schools and the district overall. Reports were not produced for schools with low participation. For questions about this report, please contact Kevin Schmidke. |
Archives
July 2024
Categories
All
|


 RSS Feed