

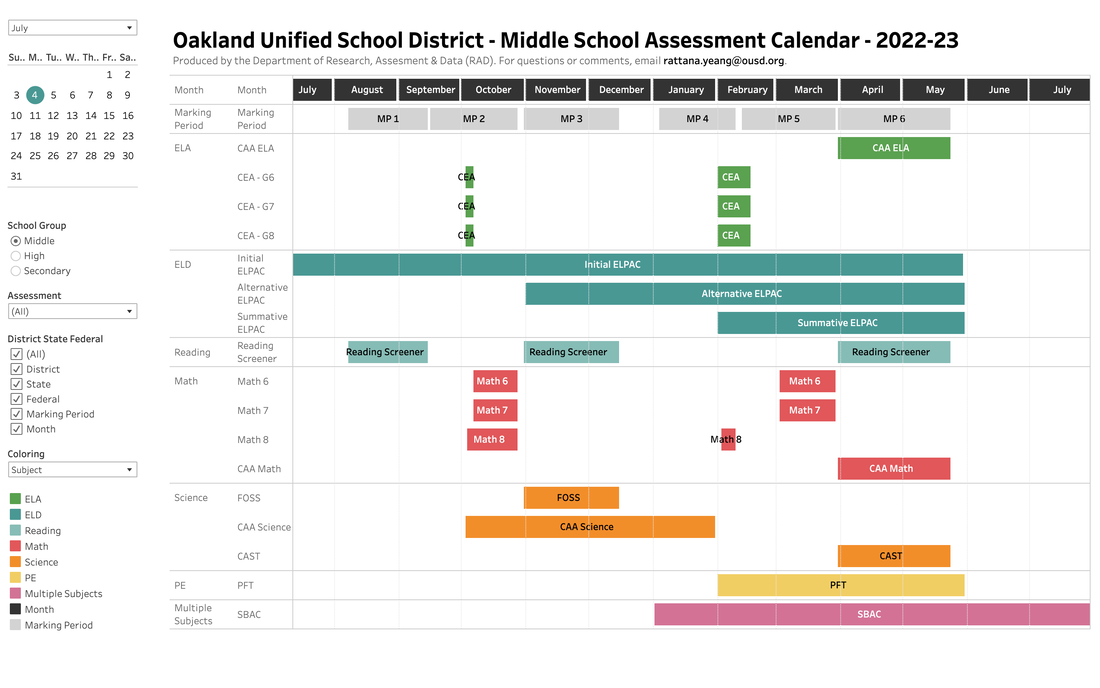
  New 2022-23 Secondary Assessment Calendars are now available for Middle and High Schools. Use filters to toggle between Middle, High, or all secondary grade levels. Include or exclude subjects or test types (district, state, or federal), and hover over any gantt chart to highlight additional information related to the start and end dates, purpose of the test, length of the test, eligible students, and district point person for administration. Note: some assessment and assessment windows are not yet finalized.
Contact: Rattana Yeang, Data Analyst, RAD, [email protected] The 4-Year Cohort Graduation Rate Dashboard tallies our graduates, non-graduate completers, still-enrolled students, and dropouts at four years after their first entering the 9th grade. The District-wide graduation rate of 72.4% was unchanged from the year prior: 1892 cohort students graduated, 1091 of them having met UC/CSU "A-G" college entrance requirement. The data source comes from the state CALPADS system. A public version of this report is available.
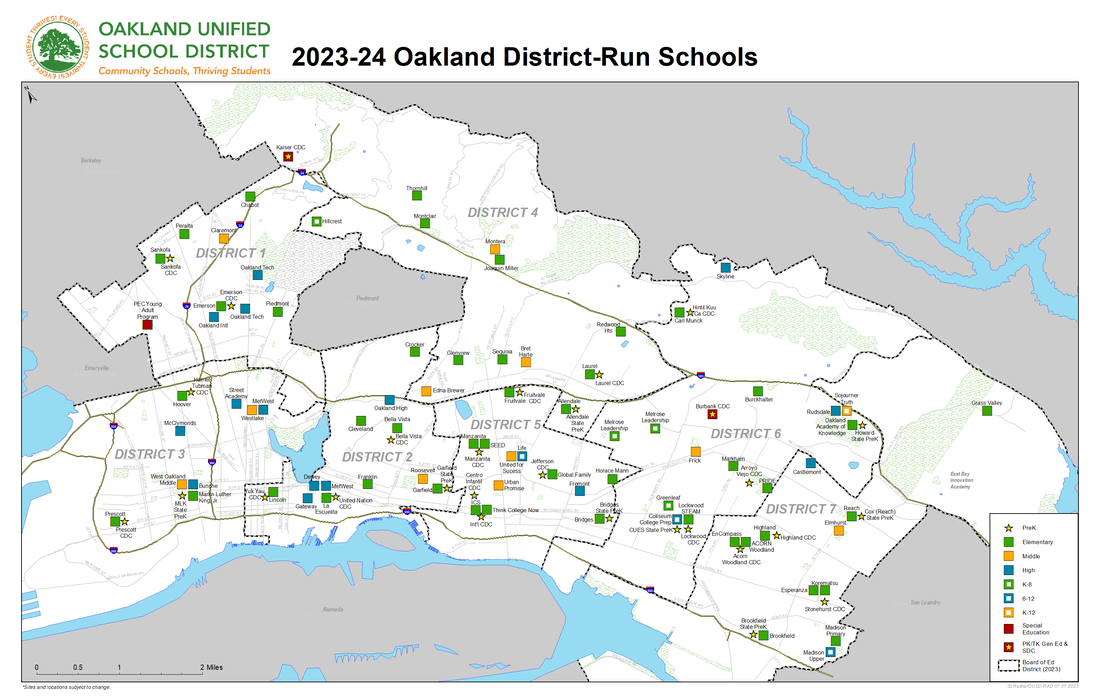
Contact: James Tharp, Data Analyst, RAD, [email protected] 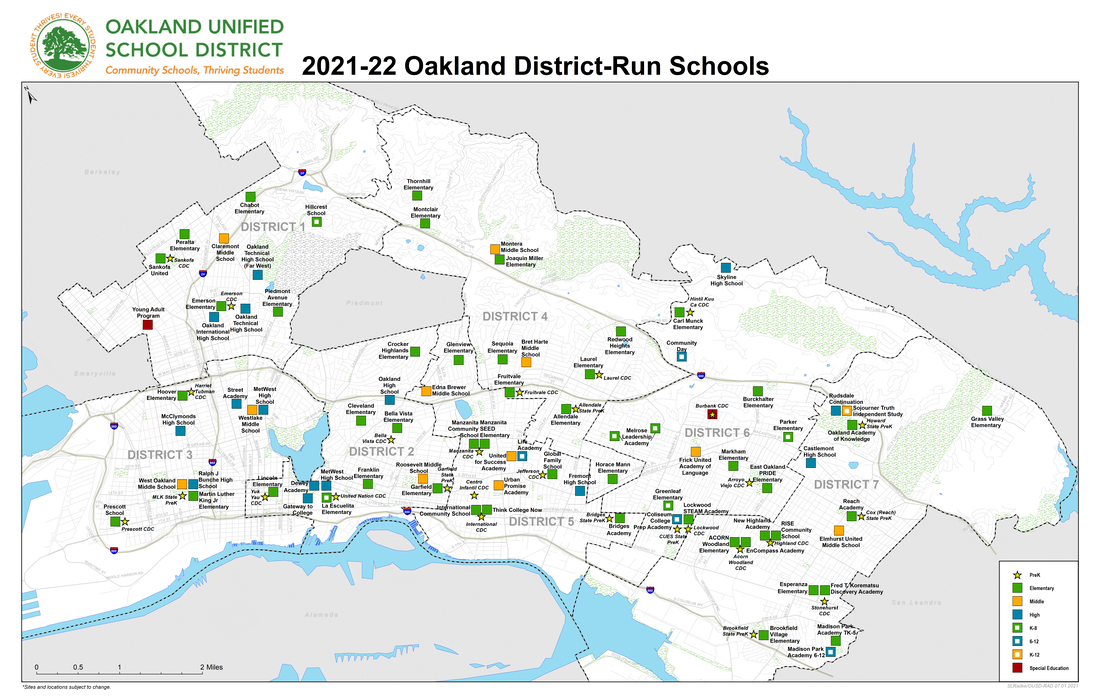 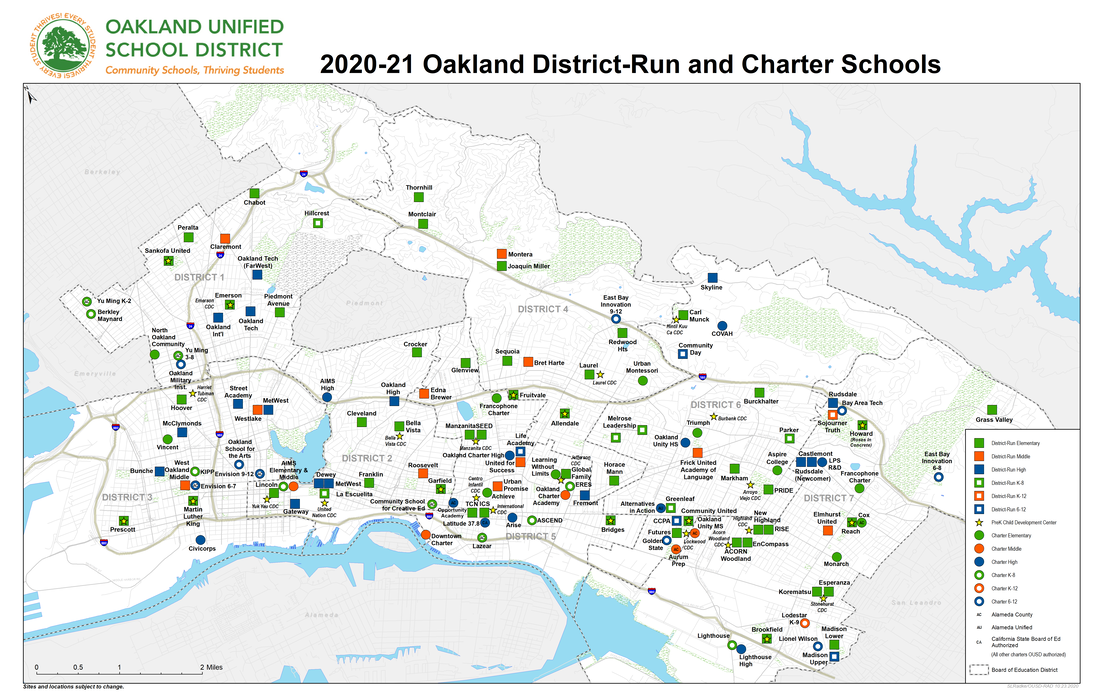 In case you missed it, we've got 2020-21 school maps available here.
Contact: Susan Radke, RAD, [email protected] 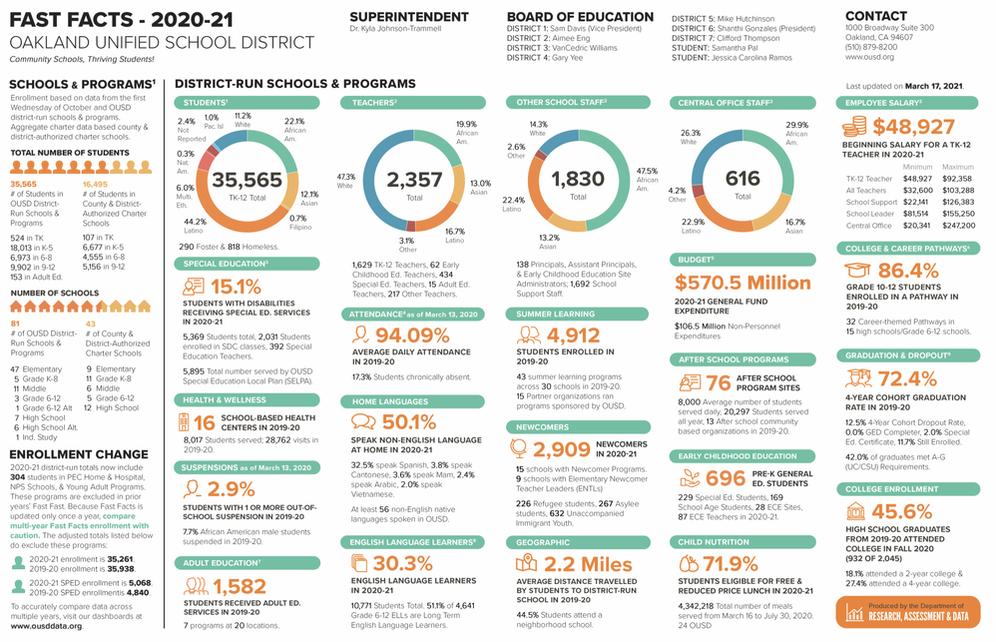 Fast Facts was designed to give you quick access to basic numbers and information on OUSD. What is our total enrollment? What is our total number of schools? What percentage of our student population is eligible for free or reduced price lunch? All these answers and more can be found on our infographic.
Contact: Rattana Yeang, RAD, [email protected] 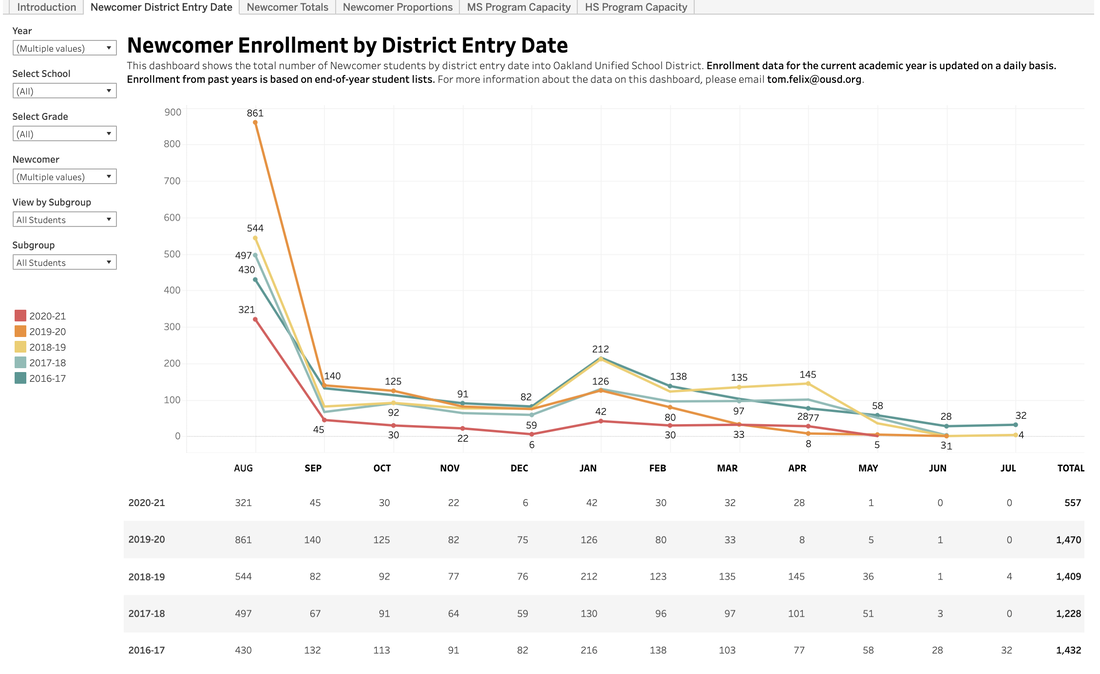
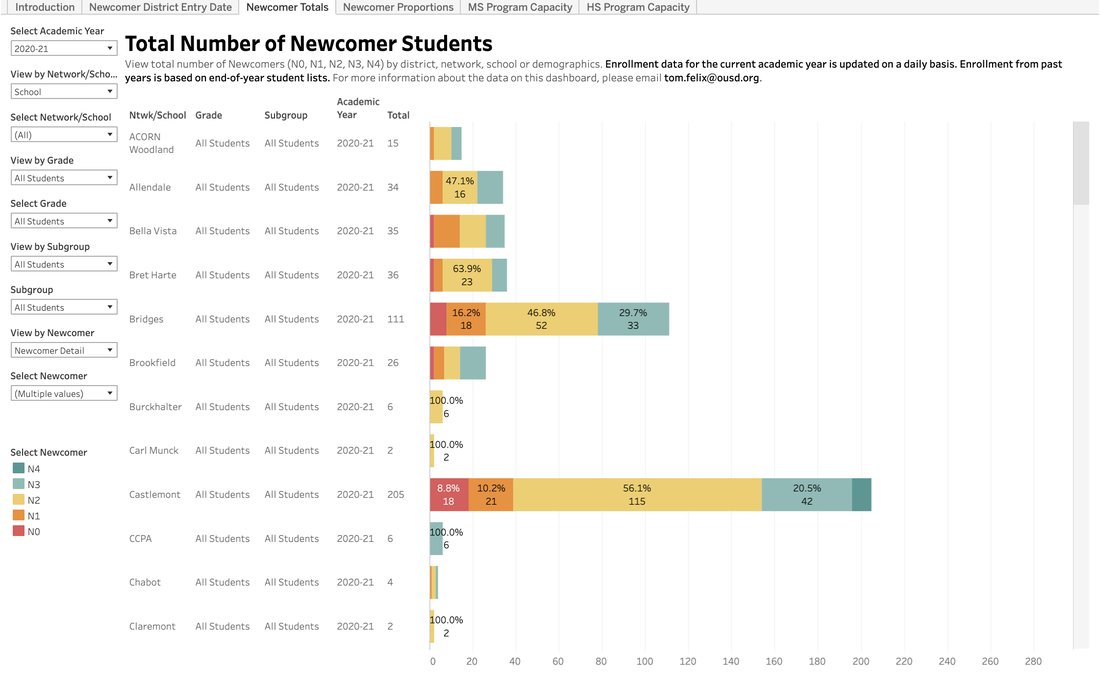
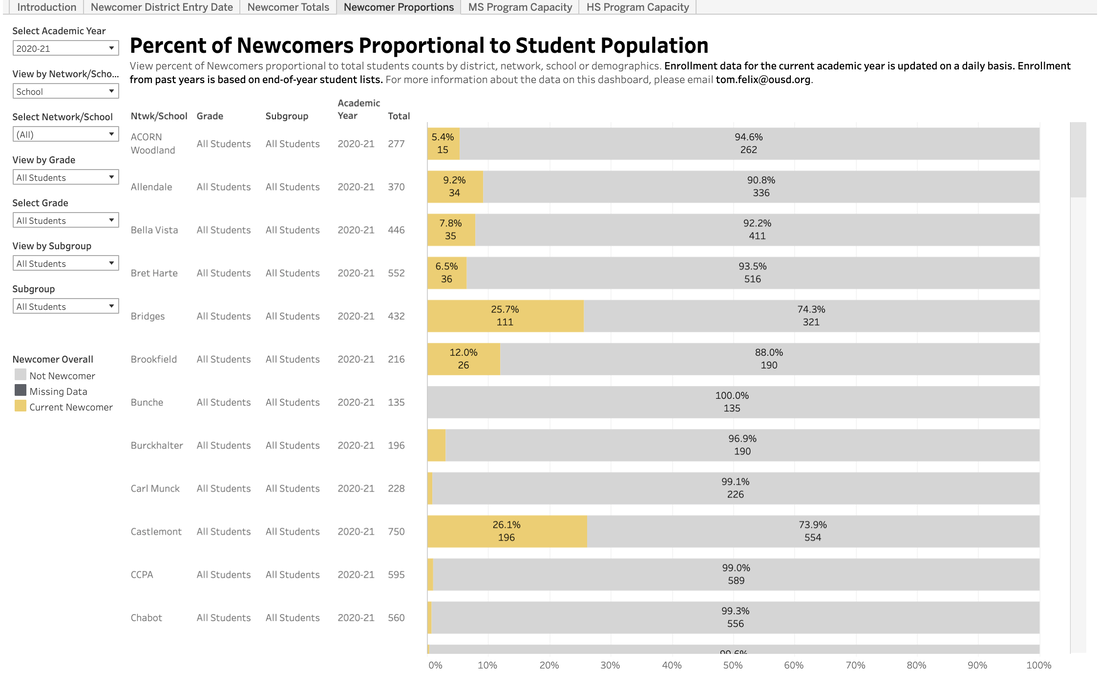
For OUSD Staff: Updated Newcomer enrollment dashboards are now available.
Newcomer Enrollment by District Entry Date - View the total number of Newcomer students by district entry date into OUSD. Newcomer Totals - View the total number of Newcomers by district, network, school or demographics. Newcomer Proportions - View percent of Newcomers proportional to total student counts by district, network, school or demographics. Contact: Rattana Yeang, RAD, [email protected] 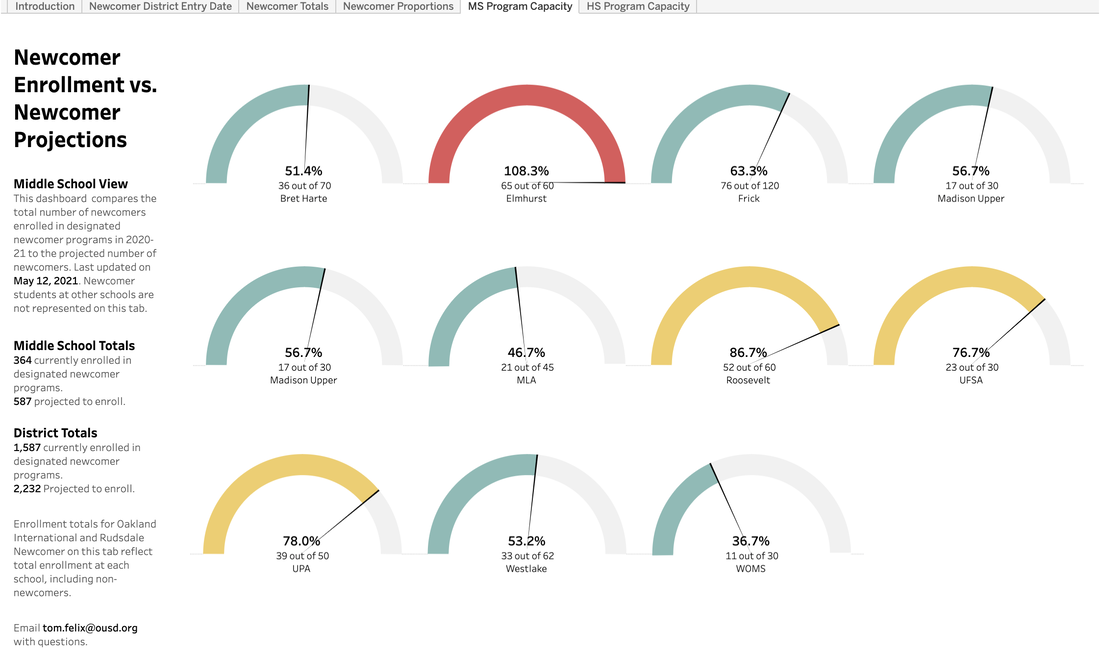 For OUSD Staff: Use these dashboards to compare the total number of newcomers enrolled in designated newcomer programs to the projected number of newcomers.
Contact: Rattana Yeang, RAD, [email protected] 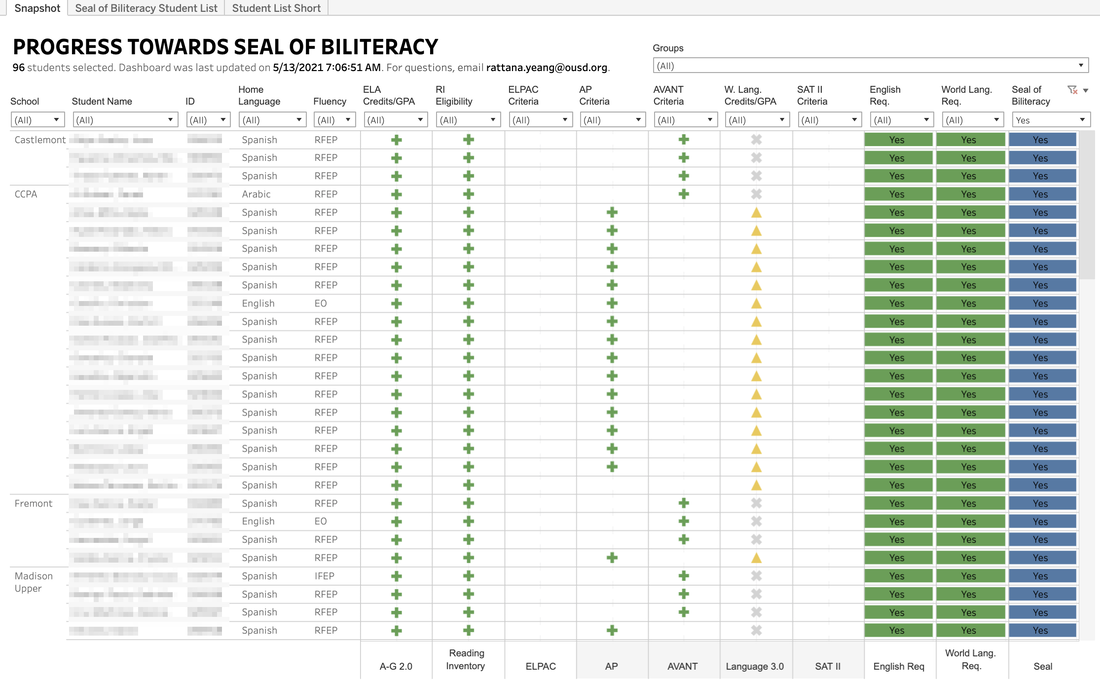 For OUSD Staff: New for 2020-21, use this dashboard to access individual student progress towards the Seal of Biliteracy. Data points include ELA credits/GPA, Lexile scores, ELPAC performance, AP test results, AVANT, World Language credits/GPA, and SAT II scores. Hover your mouse over any visual to reveal additional details. Student level spreadsheets are available for download.
Contact: Rattana Yeang, RAD, [email protected] 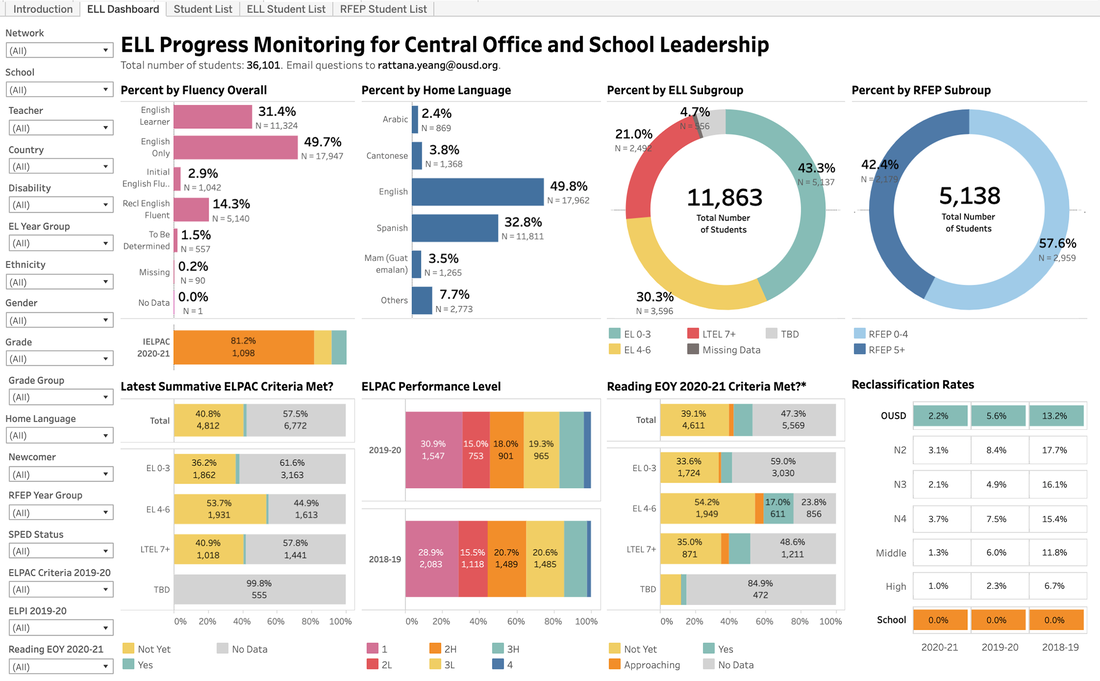 For OUSD Staff: View enrollment data by overall fluency and fluency subgroups next to priority data related to ELL progress. Newly added data points include IELPAC participation, ELPAC growth, Lexile scores, and reclassification rates all in one dashboard.
Contact: Rattana Yeang, RAD, [email protected] 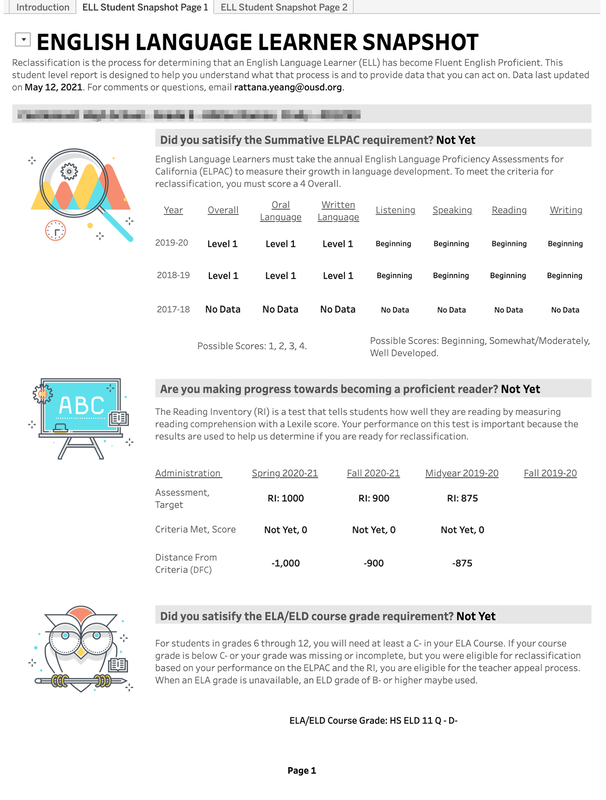 For OUSD Staff: One pagers for student, family, and teacher conversations about reclassification goals. Look up a report one student at a time.
Contact: Rattana Yeang, RAD, [email protected] 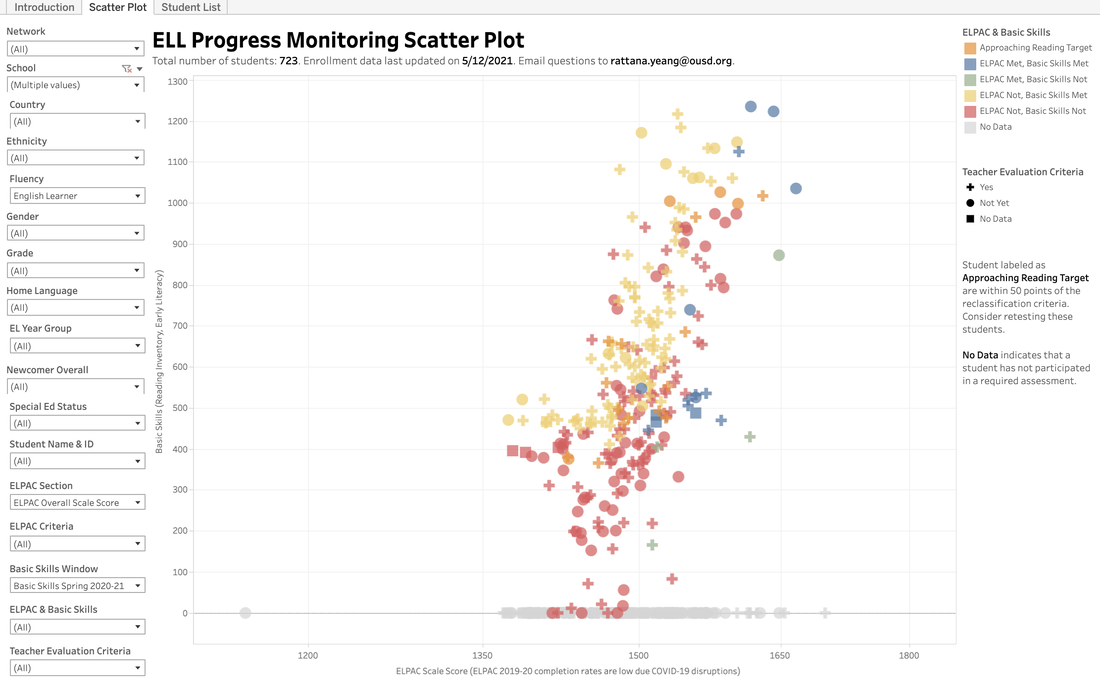 For OUSD Staff: Designed specifically for school site leads and teachers, view how far a student is from reclassification criteria in scatter plot format.
Newly added: Students within 50 Lexile points away from the Reading Inventory criteria are now highlighted in orange. Contact: Rattana Yeang, RAD, [email protected] 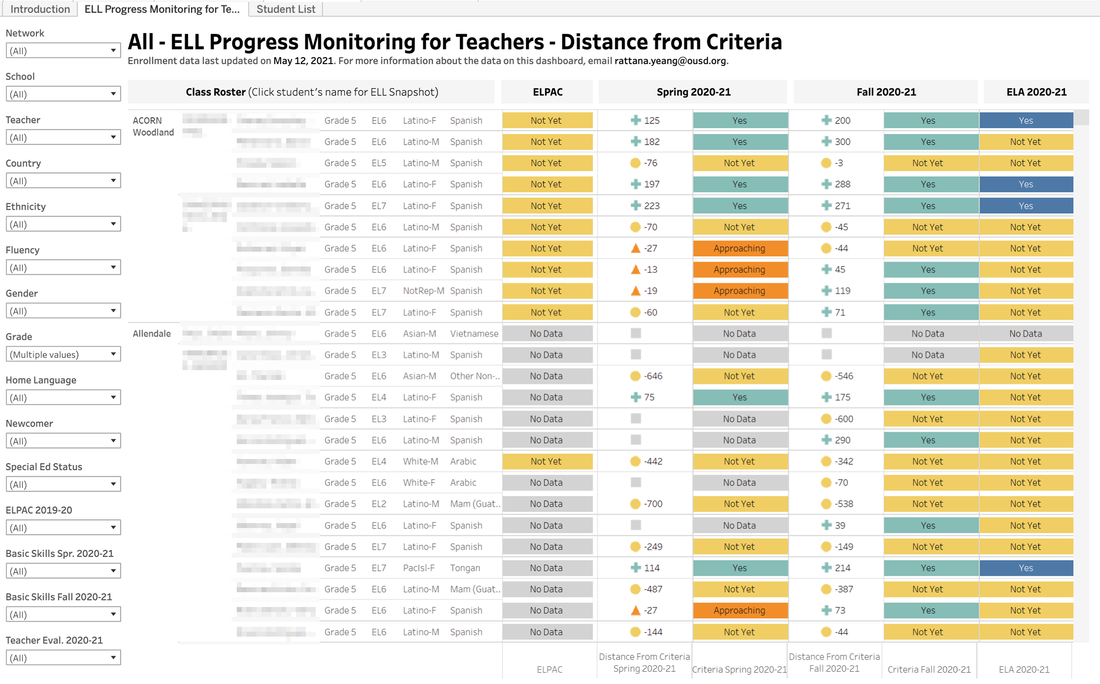 For OUSD Staff: Designed specifically for school site leads and teachers, view student rosters with data on how far a student is from each reclassification criteria.
Newly added: Students within 50 Lexile points away from the Reading Inventory criteria are now highlighted in orange. Contact: Rattana Yeang, RAD, [email protected] 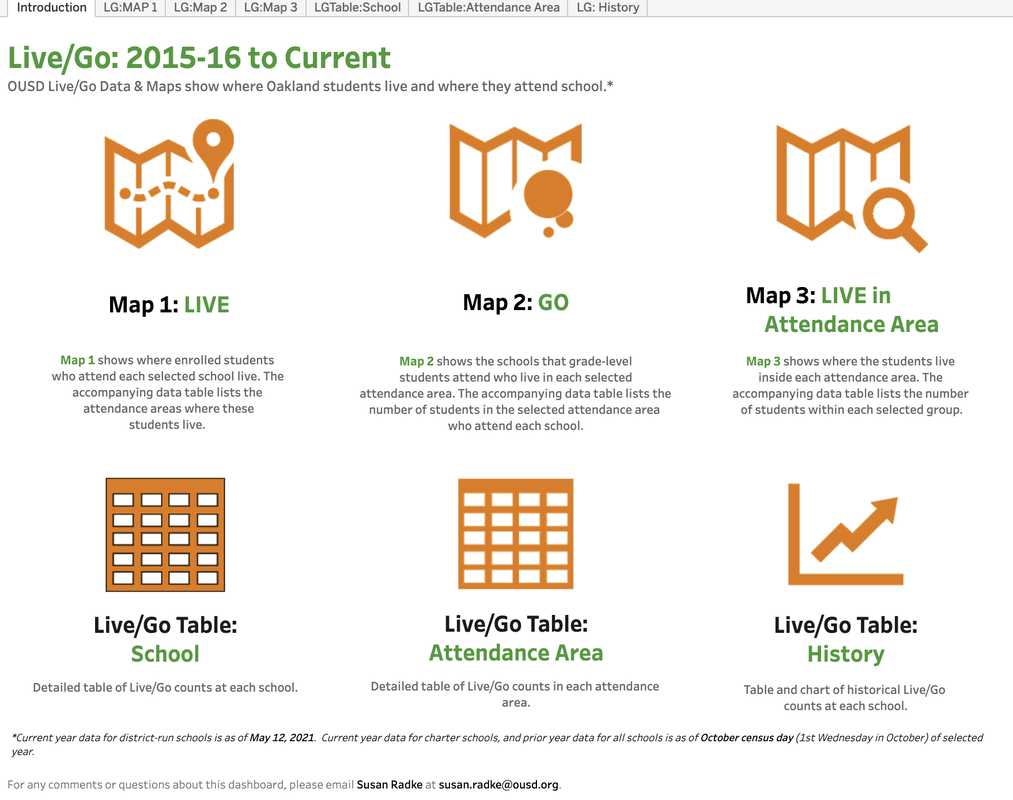 OUSD Live/Go Data & Maps show where Oakland students live and where they attend school. The latest internal Live/Go Dashboard has been updated to include 2020-21 charter school students. It now contains all currently enrolled district run students, and all charter students as of October 7, 2020.
Contact: Susan Radke, RAD, [email protected] 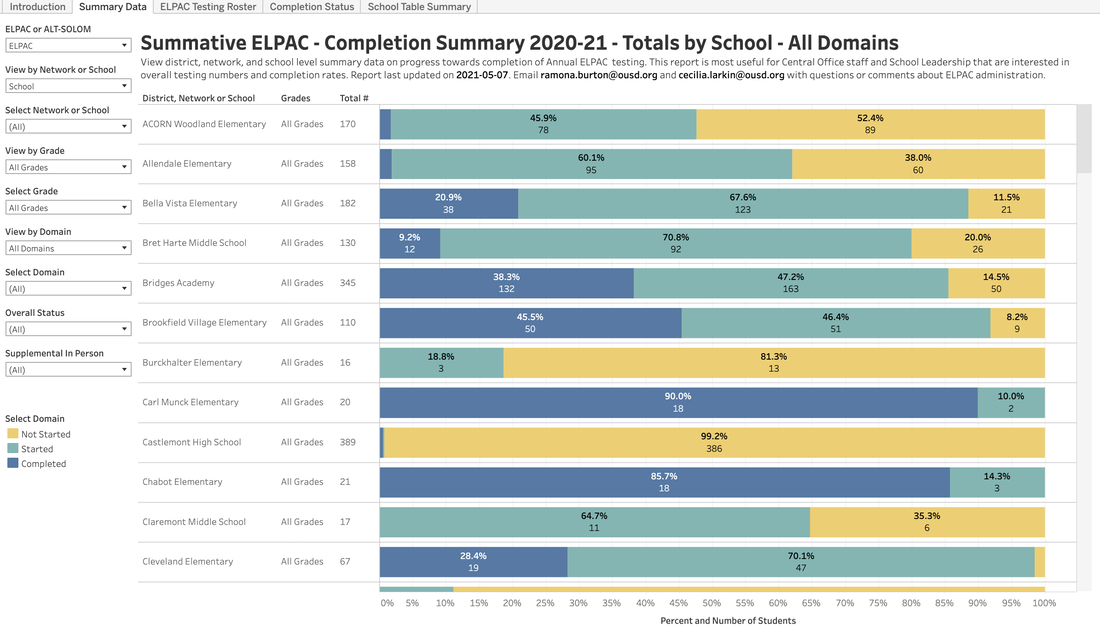 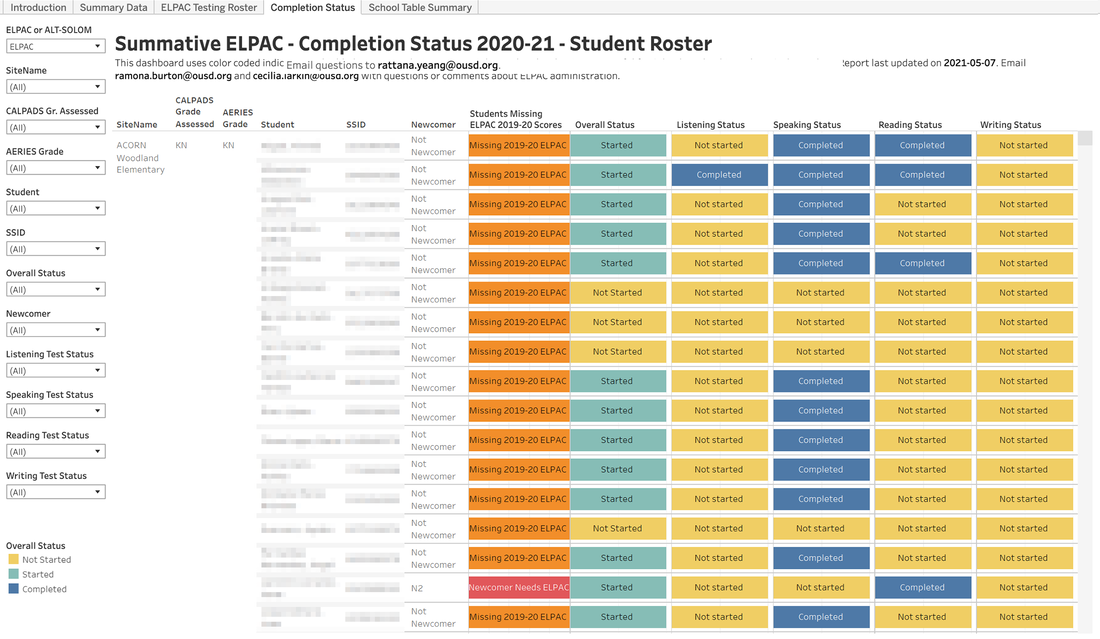 For OUSD Staff: View aggregate level data for ELPAC testing completion. There are three categories: not started, started and completed testing. Student lists are available with detailed demographics and testing data to support Testing Coordinators with implementation. Additional classroom information is available for students in supplemental/in-person instruction.
Contact: Rattana Yeang, RAD, [email protected] 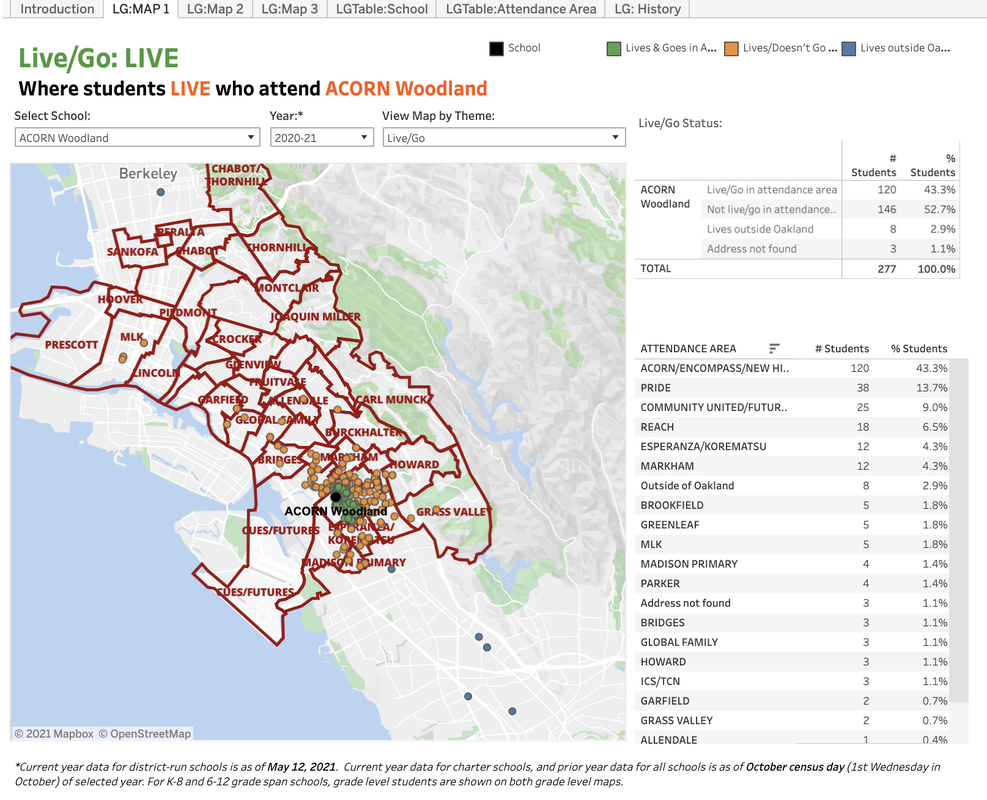 OUSD Live/Go Data & Maps show where Oakland students live and where they attend school. The latest internal Live/Go Dashboard has been updated to include 2020-21 charter school students. It now contains all currently enrolled district run students, and all charter students as of October 7, 2020.
Contact: Susan Radke, RAD, [email protected] The 4-Year Cohort Graduation and Dropout Rate Dashboard shows percent and number of OUSD students who completed high school as graduates or non-graduate completers, or who were still enrolled or had dropped out four years after first entering the 9th grade.
The data comes primarily from CALPADS student-level data, and distinguishes the students who graduated meeting UC/CSU "A-G" college entrance requirements. Dashboard "D.I.Y." view lets users disaggregate data by up to 3 of 8 available student subgroups (e.g., ethnicity, newcomer, special ed). Our overall 2020 graduation rate was 72.4%, only slightly lower than the previous year. Contact: James Tharp, Data Analyst, RAD, [email protected] NEW i-Ready Standards Mastery dashboard
The i-Ready Standards Mastery dashboard shows math and reading results from the recent Standards Mastery interims. View data by network, school, teacher, and student group. NEW i-Ready Instruction dashboard The i-Ready Instruction dashboard is designed to support networks and schools to monitor student use of i-Ready lessons. Explore what percent of students are using i-Ready lessons by school, grade, and student group. View how much time students are spending on i-Ready lessons. This dashboard will be updated weekly on Monday morning. UPDATED: i-Ready Diagnostic dashboard The i-Ready Diagnostic dashboard now shows reading and math data current as of 11/30/20. Contact: Rinat Fried, Research Associate 0-8, RAD, [email protected] |
Archives
July 2024
Categories
All
|
 RSS Feed