Contact: Kevin Smith, RAD, [email protected]
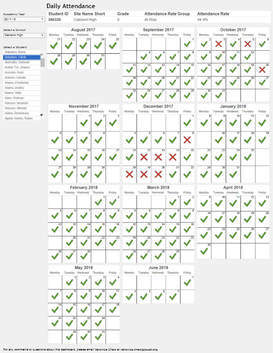
Monitor which high-absence students have received an attendance intervention, when the latest took place, and those who still need one. Keep track of all attendance interventions each student has received and their attendance before and after each intervention date. Misha Karigaca says this Dashboard is a MUST for every attendance team!
Contact: Kevin Smith, RAD, [email protected]
0 Comments
For OUSD Staff: The Period Attendance Dashboards have added to the Tardy Snapshot Dashboard a list of students who have been tardy 25% or more of their attended classes. Ranked in descending order per % of classes tardy and filterable by schedule, date, and demographic data elements.
Contact: Kevin Smith, Data Analyst II, RAD, [email protected] For OUSD Staff: The Weekly Attendance Tracker has gone through some updates and now includes a view that shows changes in student attendance based on user-selected dates. There will be a quick webinar available to those who are interested in learning more about the changes. If you are interested in attending the webinar, please complete this form asap to reserve a spot.
Contact: Juan Du, Director of Analytics, RAD, [email protected] For OUSD Staff: Percent of scheduled periods absent and percent of attended periods partially missed due to Tardies by Year, School, Date, Month, Reason, Period, Teacher, and Course. Student Profile gives detail of period attendance for current students. Grades 6-12 only.
Contact: Kevin Smith, Data Analyst II, RAD, [email protected] For OUSD Staff: This dashboard was created through a collaborative effort between OUSD's data
team and ADSS (Attendance & Discipline Support Services). Users can view student and classroom level attendance rates by week, which could prove useful for case management or running classroom challenges. Contact: Veronica Chew, Data Analyst II, RAD, [email protected] For OUSD Staff:
For OUSD staff: Weekly Chronic Absence Chronic Absence Rosters have been updated and are now available for internal OUSD Staff. They are comprised of a student roster for each school listing their severe chronic absent (80% attendance or less), and moderate chronic absent(between 80 and 90% attendance), and at risk students (between 90 and 95% attendance). These files are located in the Protected Student Level Data section of each school folder. The rosters are in Microsoft Excel format and include students' attendance rate, selected demographic information, traveling distance from school, and a summary of the types of absences to date for each student.
For more questions, please contact Kevin Smith. Weekly Chronic Absence reports have been updated and are now available for internal OUSD Staff. They include:
1. A list of schools and their chronic absence summations in Excel and PDF format. These files are located in our Internal Data Reports folder. 2. A student roster for each school and network of their chronically absent and at risk students. These files are located in the Protected Student Level Data section of each school folder. These reports show the number and percent of currently enrolled students who are chronically absent (i.e. have an attendance rate of 90% or less) and are loaded every Monday on a weekly basis. NEW: In the "OUSD Districtwide - Chronic Absence Weekly Summations" spreadsheet (located in the 00_OUSD Districtwide folder), a second tab has been added entitled “Trend Chart." This chart represents each week’s data point over time to give a visual of the school’s trend. There is also a flat bar indicating the district target of 5% or less Chronic Absent. A drop down list enables the user to select the district or a particular school. For more questions, please contact Kevin Smith. Updated “end of month” Chronic Absence reports are now available for internal OUSD staff. The report augments the weekly reports, and gives a breakdown of Satisfactory Attendance (attending 95% or more of school days) as well as Chronic Absent (attending 90% or less of school days). Extra items include:
· Percent of “Severe Chronic Absent” (attending 80% or less of school days) for all indicate student groups, as a subset of Chronic Absent. · Summation by grade level within each school as well as the entire district · Summation across entire ethnic groups as well as by ethnicity/gender · Summation of percent chronic absent for groups such as English Learners and by gender · Breakdown of percent chronic absent by teacher and course for grades K-5 The purpose of Chronic Absence (CA) reports is to inform district leaders at a given point in time (end of the week or month) the number and percent of their presently enrolled students that are chronically absent (attendance rate of 90% or less). This enables principals to monitor their school’s progress in fighting student absenteeism as well as progress for each student with an attendance problem on a weekly basis and enact interventions as needed. Chronic Absence reporting has become integral to OUSD efforts to boost attendance at all grade levels. For more questions, please contact Kevin Smith. The OUSD Web Map Center is now up and running at http://ousd.maps.arcgis.com/home/. The online Center hosts a collection of maps and apps that support administrative, planning, and research initiatives undertaken by the Research, Assessment & Data (RAD) department of the Oakland Unified School District. Current maps include:
2014-15 school sites, attendance areas and district council boundaries Opportunity Mapping Environmental Factors School-Community Partnerships Live/Go 2014-15 TK programs and planning Asset Management/Programs Map The site is dynamic and the maps available will change as requests and applications are developed in support of OUSD planning and analysis. So, please check back periodically to see what new maps become available throughout the year. For questions about the OUSD Web Map Center, please contact Susan Radke. |
Archives
July 2024
Categories
All
|