Contact: Rattana Yeang, Data Analyst II, RAD, [email protected]
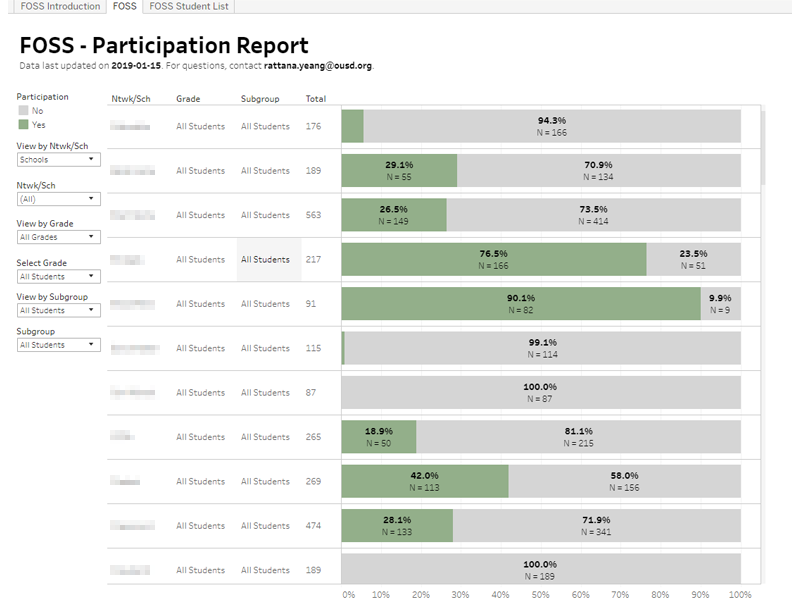
For OUSD Staff: Participation rates from the Fall implementation are based on fully scored assessments results only. Anyone with OUSD email account can access the report here.
Contact: Rattana Yeang, Data Analyst II, RAD, [email protected]
0 Comments
For OUSD Staff: the SIRA participation rate dashboard for the Fall administration is now available! Interact with the dashboard to find out SIRA participation rates by network, by school, by grade and by teacher. Authorized users will be able to drill down to student level data including performance results. For questions, contact Juan Du at [email protected].
For OUSD Staff: Spring 2016 was the final administration of CST/CMA/CAPA Science assessments for students in grades 5, 8, and 10. Nearly 7000 students participated.
In Spring 2017, our students will participate in pilot testing of assessments based on NGSS standards. Results from 2015 and 2016 are available in the CAASPP Science interactive dashboard. For questions about this dashboard, please contact Jay Tharp at [email protected] The CST/CMA Science assessment results reports are now available on the Data Team’s Google Drive. The reports compare 2013 and 2014 Grade 5 Science, Grade 8 Science, and Grade 10 Life Science results by school and for the district as a whole.
When comparing performance from last year to this year, keep in mind that OUSD’s science instruction is in the midst of shifting to the Next Generation Science Standards. Because the standards the CST/CMA Science assessment is based on are no longer in use, the District has deemphasized this test. Reports are available in both Excel and PDF formats, and Student Rosters for each school’s test takers are also loaded to the schools’ Protected Student Level Data folders. For questions about this report, please contact Kevin Smith. |
Archives
July 2024
Categories
All
|