Contact: Jay Tharp, Data Analyst, Research, Assessment and Data, James.Tharp@ousd.org
|
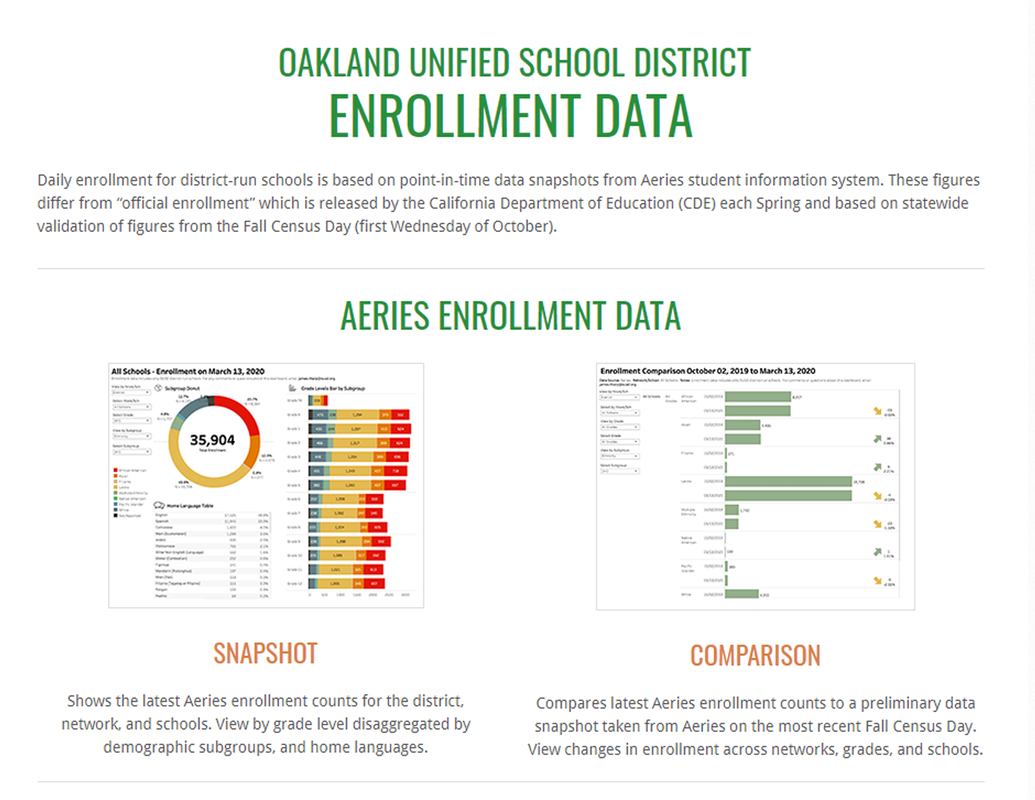
Daily updated from Aeries, Enrollment dashboards for internal OUSD staff offer disaggregation by school, network, grade level, and a dozen demographic dimensions. New demographic dimensions tracked for 2020-21: EL_Year and EL_Year_Group (from Aeries LAC.YEL), and Newcomer (from Aeries LAC.U5). A DIY (do-it-yourself) dashboard is available for your further exploration.
Contact: Jay Tharp, Data Analyst, Research, Assessment and Data, James.Tharp@ousd.org
0 Comments
A new dashboard giving status on Registration Data Confirmations overall by district and school and for each student is now available. Dashboards differentiate between students whose Confirmation Status is Confirmed, Partially Confirmed and Not Started. For each school and the district as a whole. Filters also available for Grade, Home Language and SDC (Special Day Class) Status.
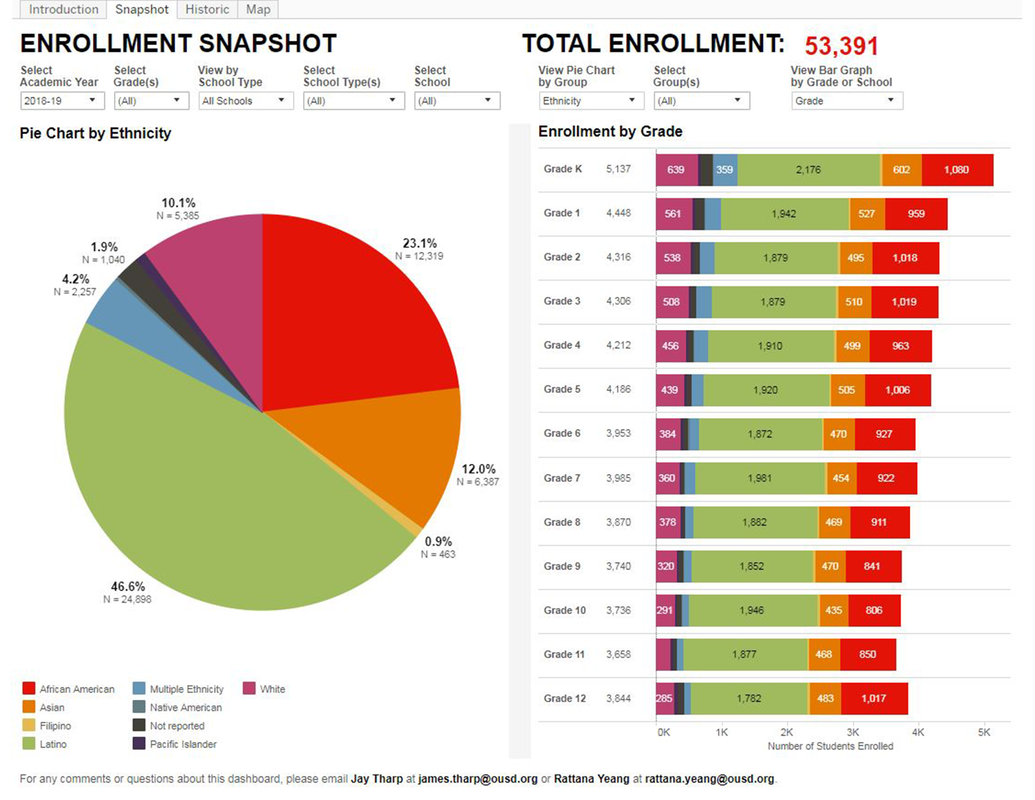
Contact: Kevin Smith, Data Analyst II, RAD, [email protected] The Enrollment Dashboard now has CDE's official 2018-19 data from the Fall Census. Included: all public schools located in Oakland. Explore more, by downloading data for use in your own spreadsheets.
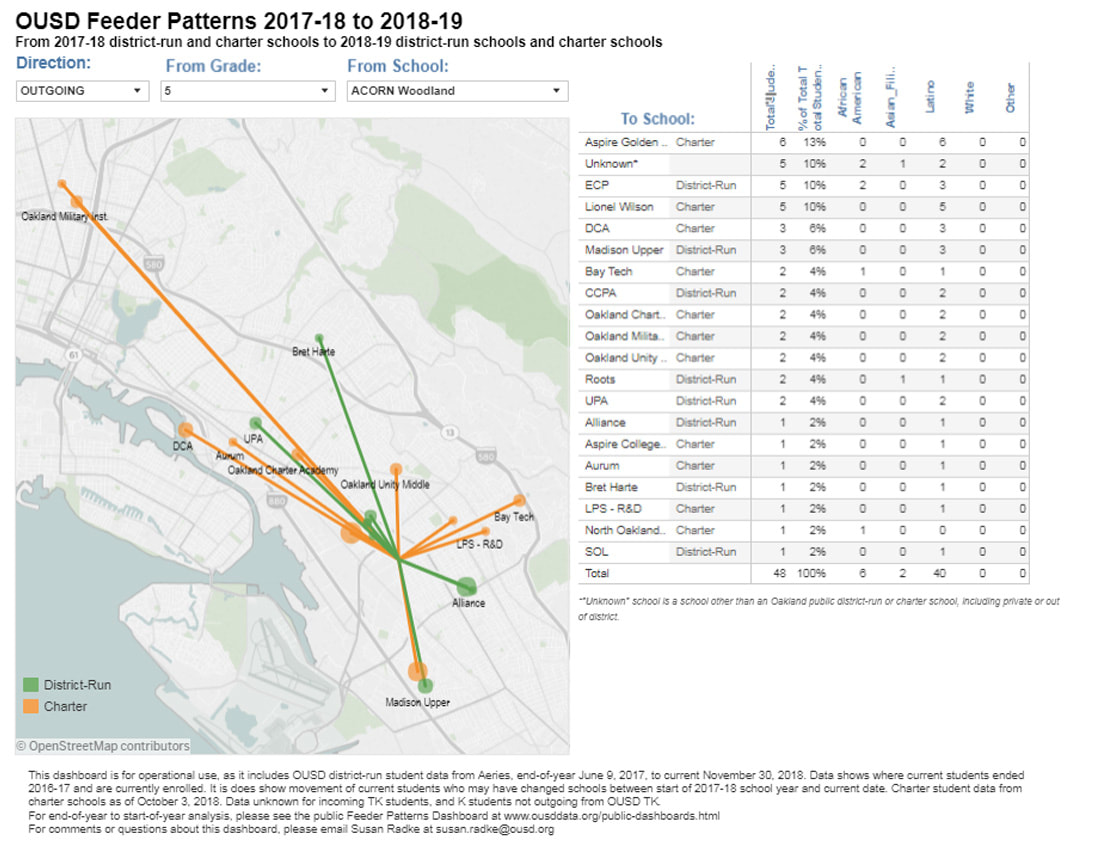
Contact: James Tharp, Data Analyst II, RAD, james.tharp@ousd.org For OUSD Staff: Use these dashboards to identify which schools students go to and come from year to year across OUSD district-run and charter schools.
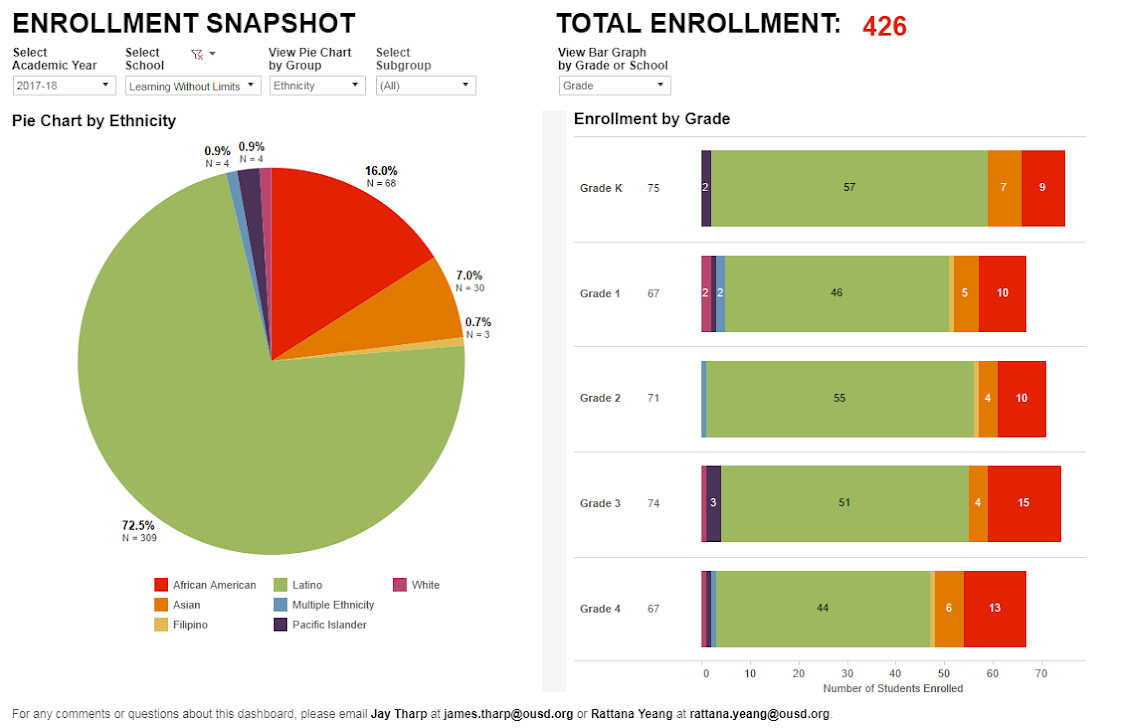
Contact: Susan Radke, Mapping Analytics Specialist, RAD, [email protected] For use by the public and OUSD staff: Our Enrollment Dashboard has been updated with CDE's official 2017-18 Enrollment figures. OUSD-Authorized charter schools and District-run schools are included.
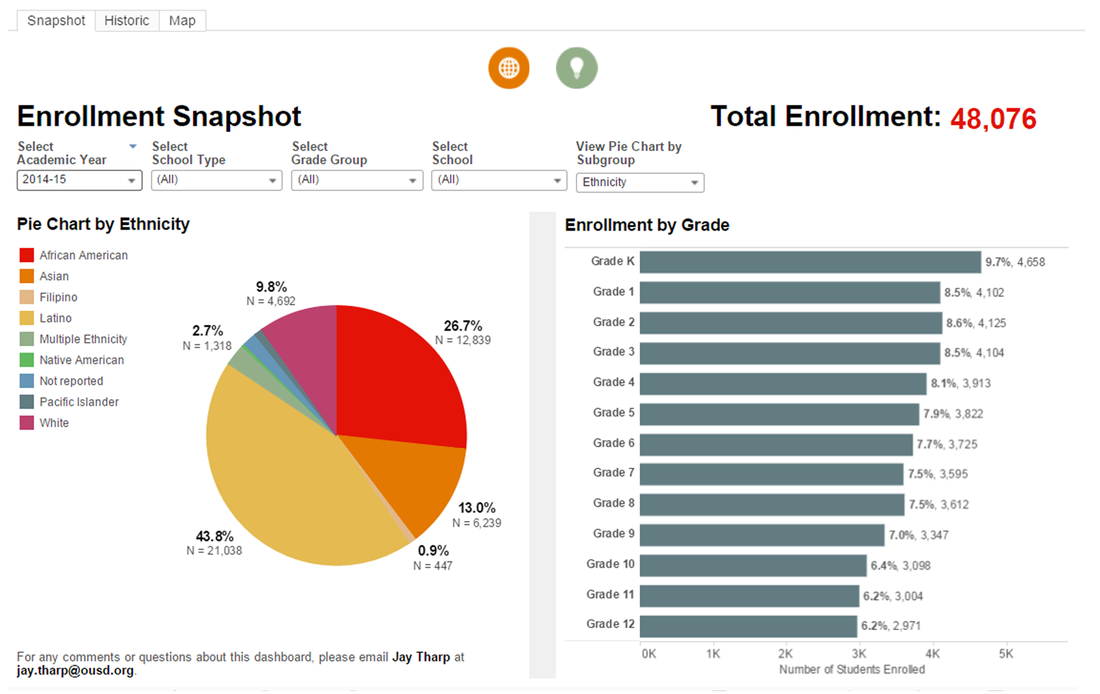
State CDE's figures are from the annual Fall Census Day in October, and allow disaggregation by grade, gender, and ethnicity. The dashboard Includes historic data back to 2000-01, plus maps for 2009-10 and later. For questions about this resource, please contact James Tharp at [email protected] or Rattana Yeang at rattana.[email protected]. For use by the public and OUSD staff: Our Enrollment Dashboard has been updated with CDE's 2016-17 Enrollment figures. District-run schools and OUSD-Authorized charter schools are included
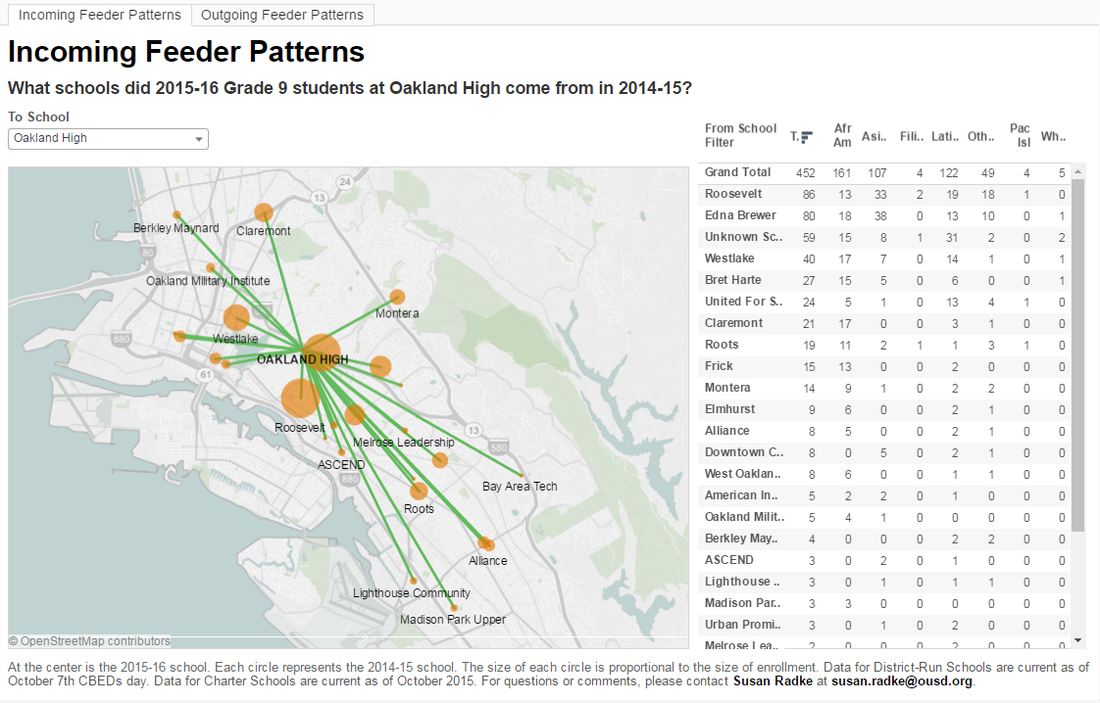
State CDE's figures are from the annual Fall Census Day in October, and allow disaggregation by grade, gender, and ethnicity. Explore enrollment distributions and trends as far back as the 2000-01 academic year. (School location data in the Enrollment Map is available starting in the 2009-10 academic year.) For questions about these dashboards, please contact James Tharp at [email protected] or Rattana Yeang at rattana[email protected]. For use by the public and OUSD staff: What schools did our grade 6 and 9, 2015-16 students come from in 2014-15? What schools did our grade 5 and 8, 2014-15 students go to in 2015-16? Use our new Feeder Pattern Dashboards to begin answering some of these questions.
The dashboard includes both Incoming and Outgoing maps. At the center of the Outgoing map is the location of the selected 2014-15 school. Each feeder line ends at a 2015-16 school with a circle proportional in size to the number of students transitioning to that school. Conversely, at the center of the Incoming map is the location of the selected 2015-16 school. Each feeder line ends at a 2014-15 school with a circle proportional in size to the number of students from that school. Data for District-Run Schools are current as of October 7th CBEDs day. Data for Charter Schools are current as of October 2015. An "Unknown School" is a school other than an Oakland public school. Ethnicity data is limited for Charter students. For any additional questions about these dashboards, please contact Susan Radke at [email protected]. For use by the public and OUSD staff: Our new Enrollment Dashboard is now available!
These enrollment dashboards are based on official enrollment numbers from the state."Official enrollment" refers to the number released by the California Department of Education in the Spring of the academic year. The number is based on an enrollment list that OUSD submits to the state as of the first Wednesday in October. This is the annual school census day throughout California. What happens between Fall and Spring? The October data file is cleaned up so it is as accurate as possible. Use these dashboards to view data across multiple years for both district-run schools and district-authorized charter schools. Explore CDE data as far back as the 2000-01 academic year* with enrollment disaggregated by grade, gender, and ethnicity. *School location data in the Enrollment Map is available starting in the 2009-10 academic year. For any additional questions about these dashboards, please contact James Tharp at [email protected] or Rattana Yeang at rattana[email protected]. Oakland Unified School District's annual K-12 enrollment figures for 2014-15 are now available. You can download them through the links provided below or download them from the Enrollment folder inside our Internal Data Reports page. Data is provided in Excel format and is disaggregated by either:
1. By school and grade level breakdowns or 2. By school, grade, ethnic, and gender breakdowns. These annual final enrollment figures come from the Aeries student information system on CBEDS Day 10/1/2014. Final enrollment figures for 2014-15 will be calculated and published by the CA Dept. of Education, in April 2015, based on Census Day (10/1/2014) figures from the CALPADS pupil data system. For more information about enrollment numbers at at OUSD, please refer to the enrollment section under our FAQ Page. For questions about these reports, please contact James Tharp. |
Archives
July 2024
Categories
All
|


 RSS Feed