|
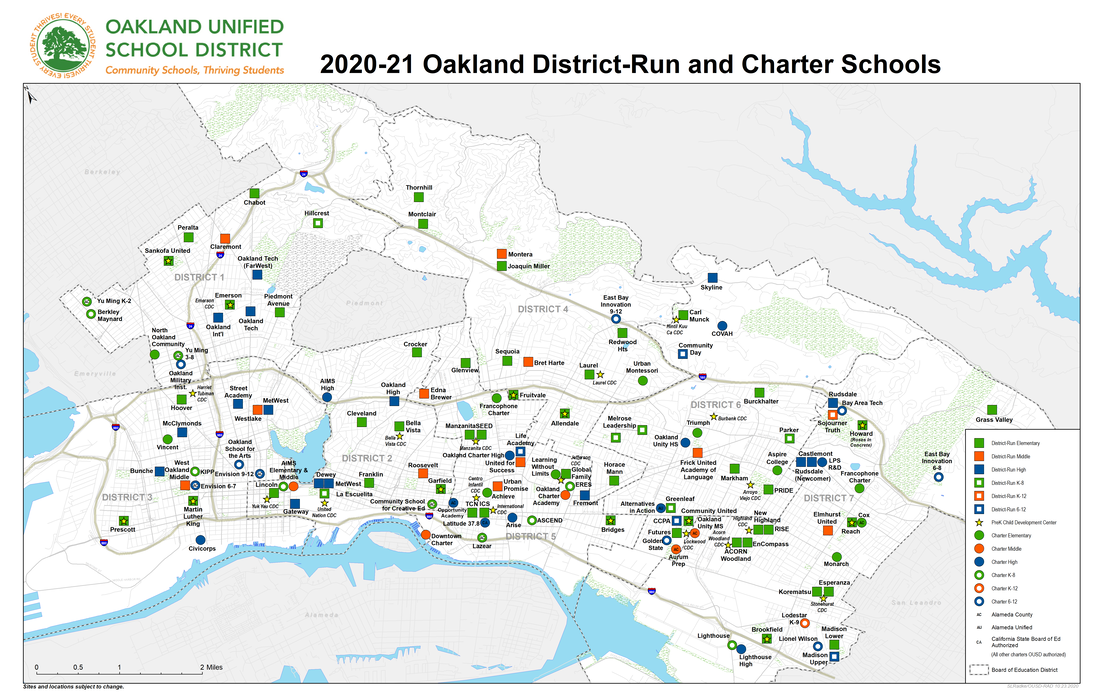
In case you missed it, we've got 2020-21 school maps available here.
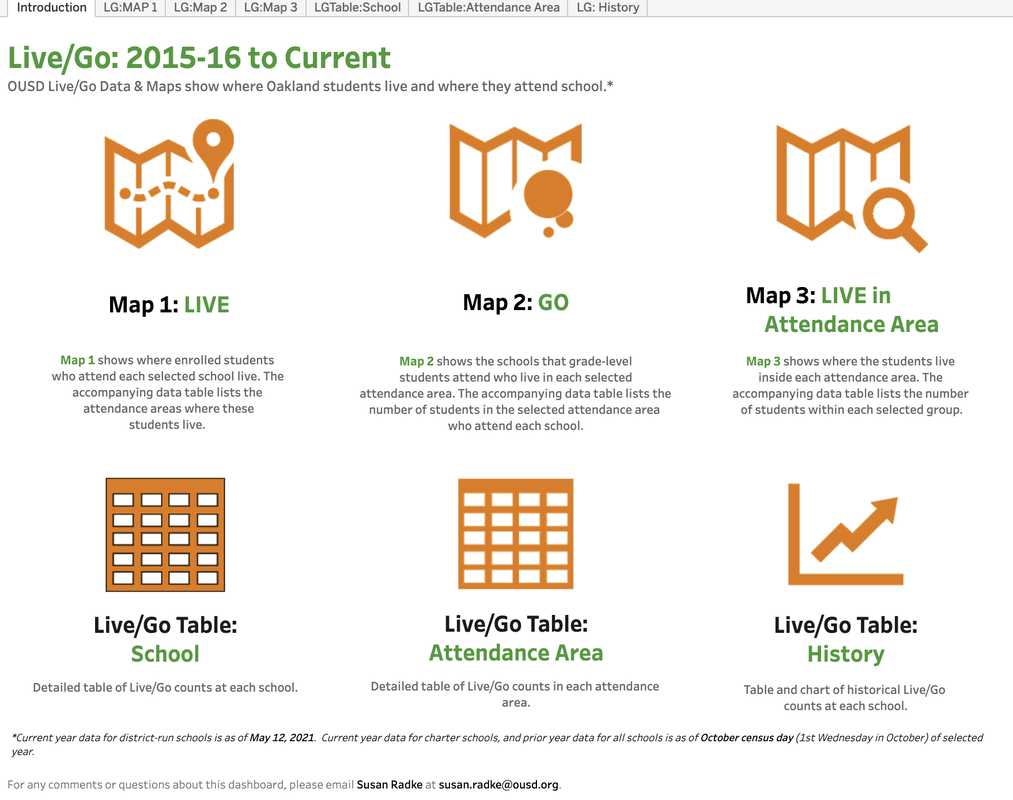
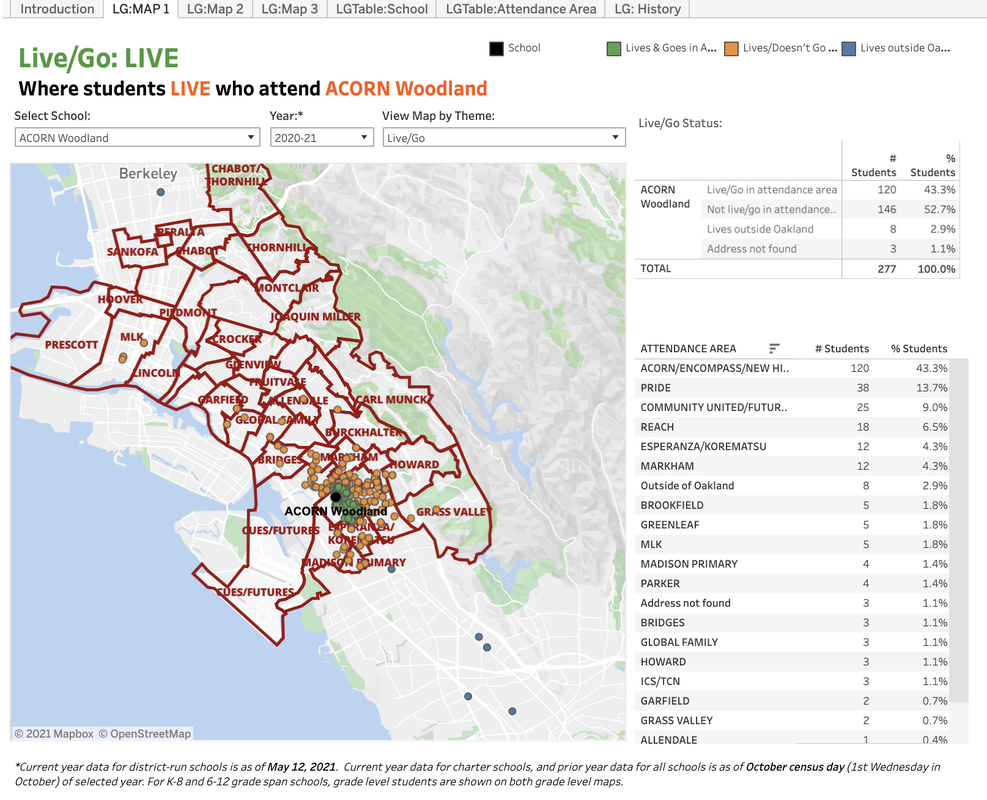
Contact: Susan Radke, RAD, [email protected] OUSD Live/Go Data & Maps show where Oakland students live and where they attend school. The latest internal Live/Go Dashboard has been updated to include 2020-21 charter school students. It now contains all currently enrolled district run students, and all charter students as of October 7, 2020.
Contact: Susan Radke, RAD, [email protected] OUSD Live/Go Data & Maps show where Oakland students live and where they attend school. The latest internal Live/Go Dashboard has been updated to include 2020-21 charter school students. It now contains all currently enrolled district run students, and all charter students as of October 7, 2020.
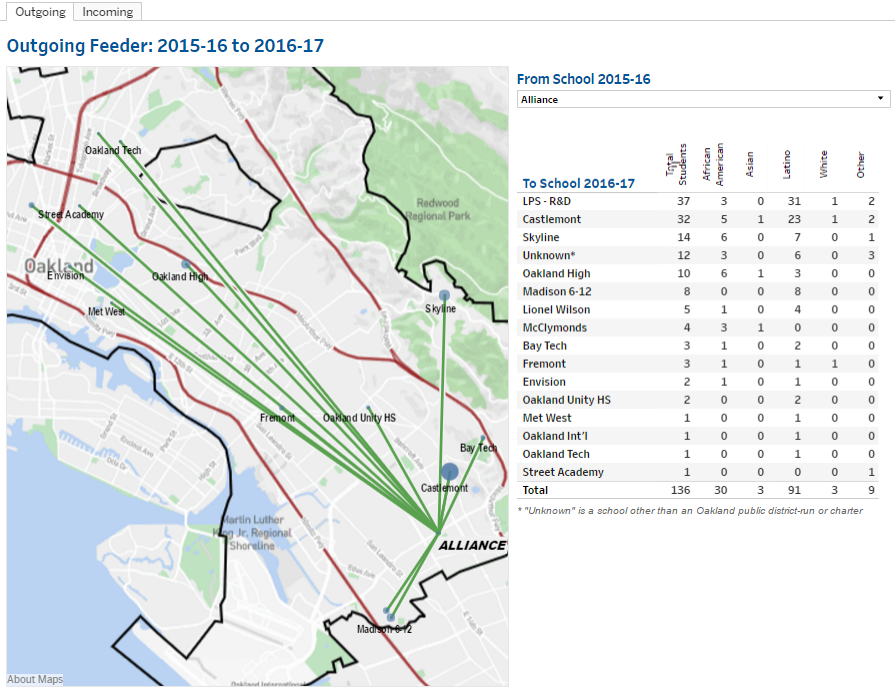
Contact: Susan Radke, RAD, [email protected] For OUSD Staff: the Feeder Patterns Dashboard has been updated. It now contains patterns of where 2015-16 students enrolled in schools in 2016-17. Data includes students in district-run schools at end of year June 9, 2016 to census day October 5, 2016. Data for students in charter schools is from October 2015 to October 2016. Patterns are identified by ethnic group for outgoing transition grades 5 and 8; and incoming transition grades 6 and 9.
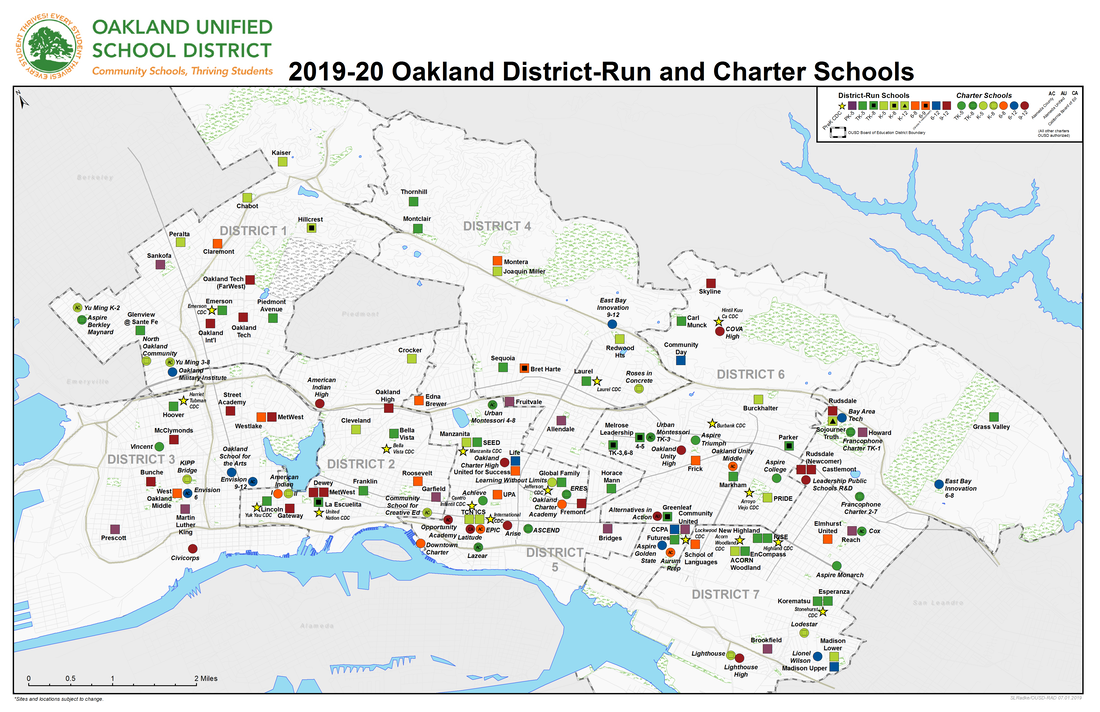
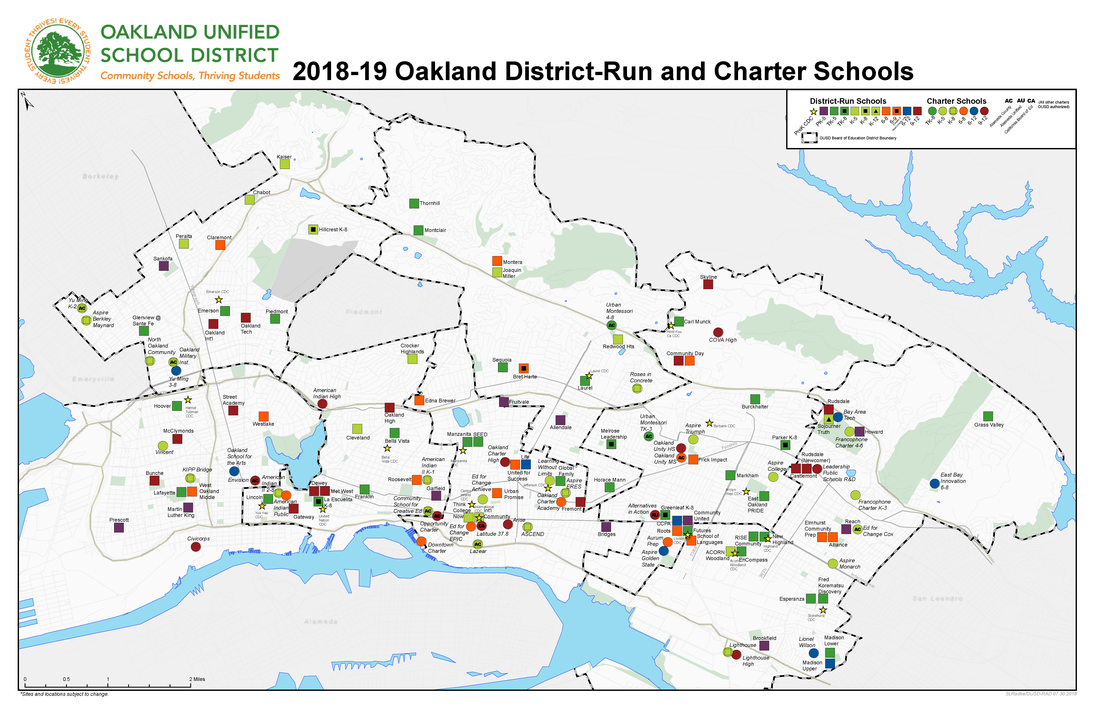
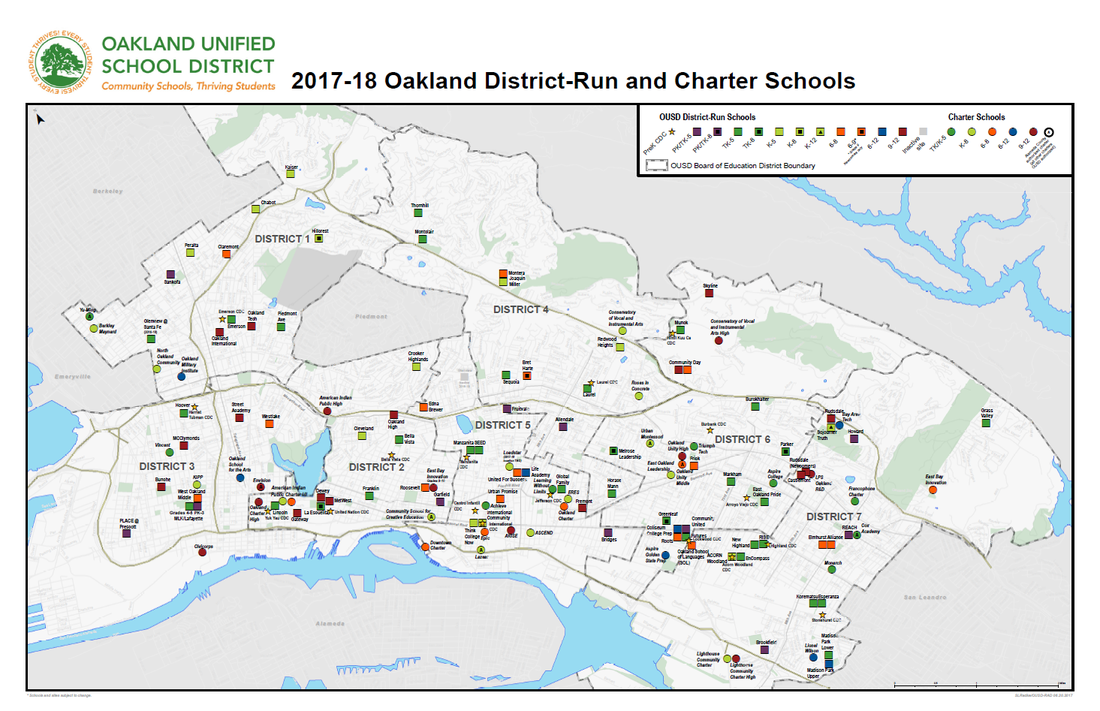
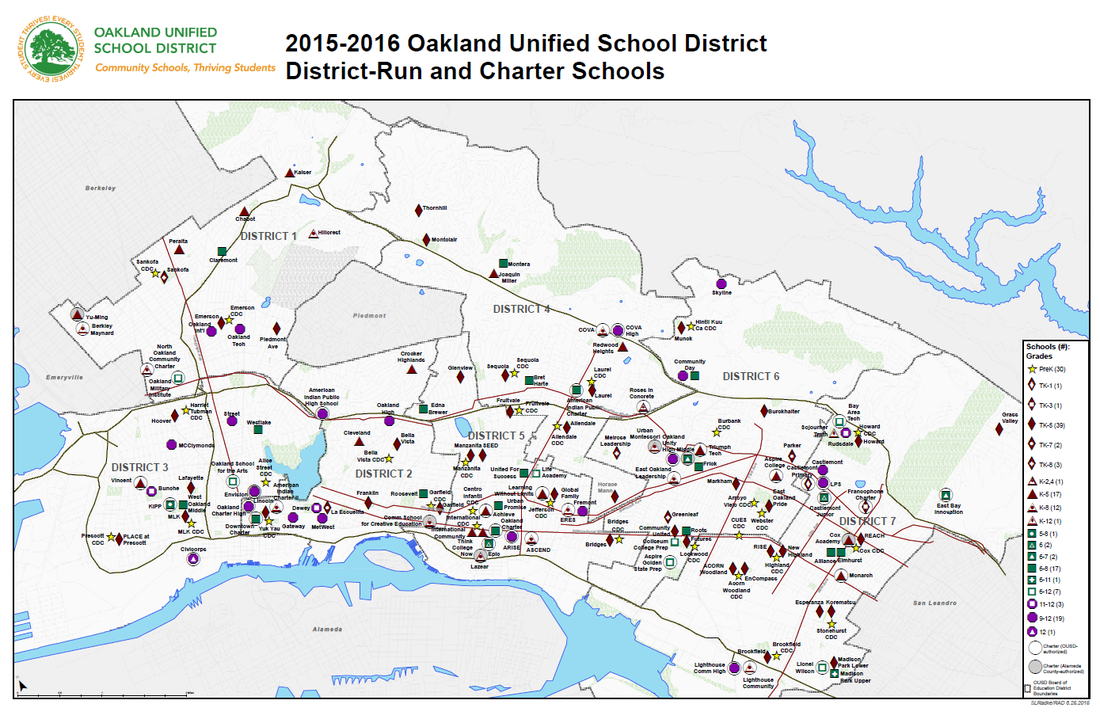
See the public version of this dashboard HERE. Please contact Susan Radke at [email protected] with any questions. This map includes all current OUSD district-run and charter schools; and, Alameda County-authorized charter schools, as of August 16, 2016. A live map is available HERE. For questions about these maps, please contact Susan Radke at [email protected].
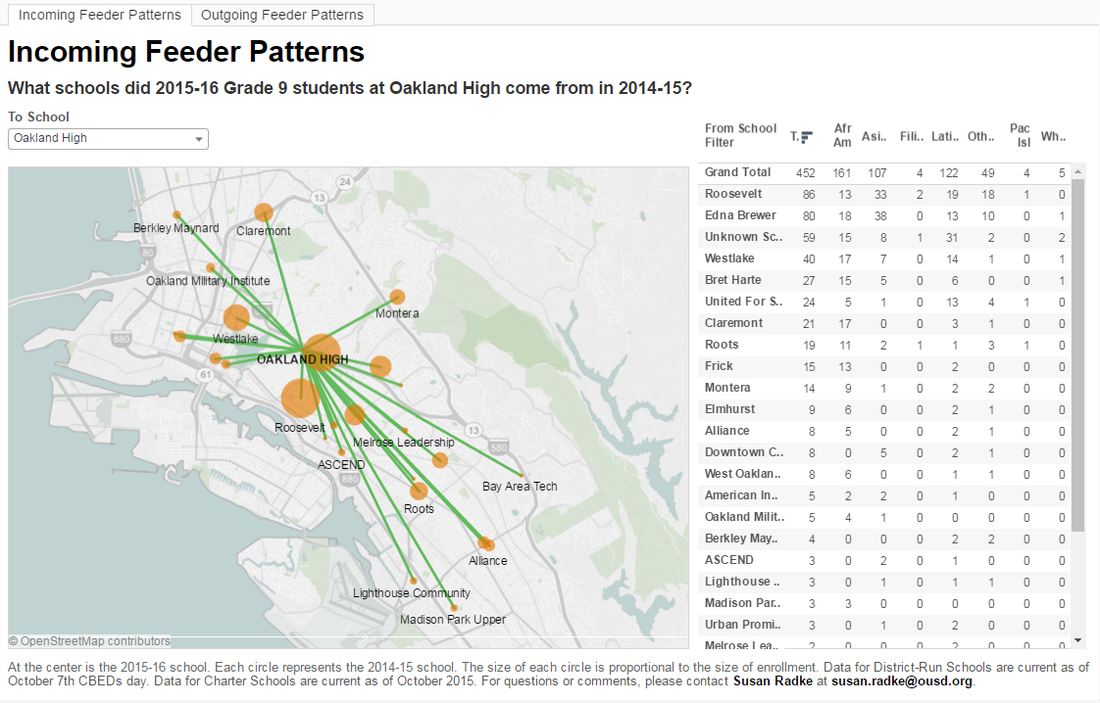
For use by the public and OUSD staff: What schools did our grade 6 and 9, 2015-16 students come from in 2014-15? What schools did our grade 5 and 8, 2014-15 students go to in 2015-16? Use our new Feeder Pattern Dashboards to begin answering some of these questions.
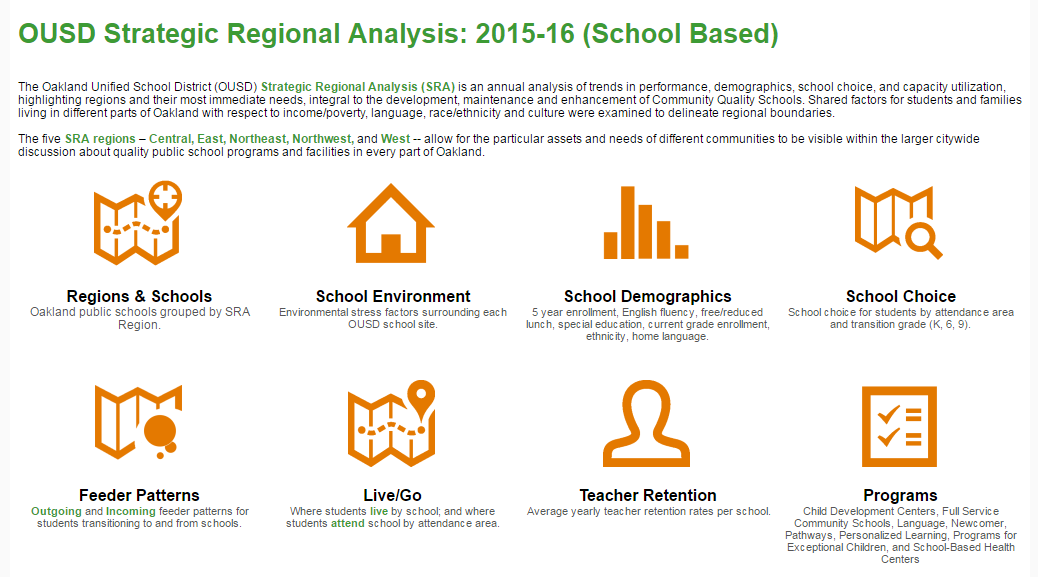
The dashboard includes both Incoming and Outgoing maps. At the center of the Outgoing map is the location of the selected 2014-15 school. Each feeder line ends at a 2015-16 school with a circle proportional in size to the number of students transitioning to that school. Conversely, at the center of the Incoming map is the location of the selected 2015-16 school. Each feeder line ends at a 2014-15 school with a circle proportional in size to the number of students from that school. Data for District-Run Schools are current as of October 7th CBEDs day. Data for Charter Schools are current as of October 2015. An "Unknown School" is a school other than an Oakland public school. Ethnicity data is limited for Charter students. For any additional questions about these dashboards, please contact Susan Radke at [email protected]. The Oakland Unified School District Strategic Regional Analysis (SRA) is an annual analysis of trends in performance, demographics, school choice, and capacity utilization, highlighting regions and their most immediate needs, integral to the development, maintenance and enhancement of Community Quality Schools.
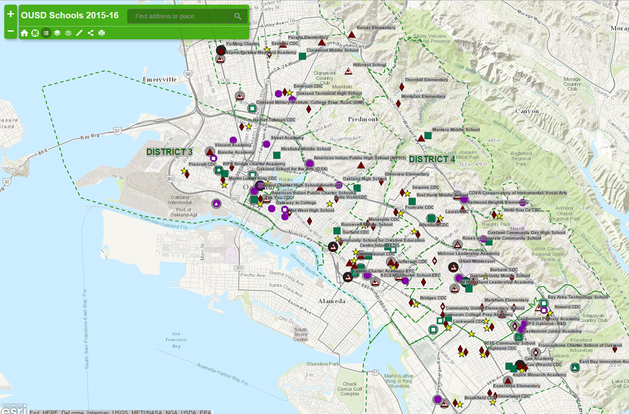
Shared factors for students and families living in different parts of Oakland with respect to income/poverty, language, race/ethnicity and culture were explored to delineate regional boundaries. The five SRA regions – West, Northwest, Central, Northeast, and East -- allow for the particular assets and needs of different communities to be visible within the larger citywide discussion about quality public school programs and facilities in every part of Oakland. For questions about this dashboard, please contact Susan Radke. This interactive map includes all current OUSD district-run and charter schools; and, Alameda County-authorized charter schools, as of June 24, 2015. Zoom, pan and click on individual schools to show detailed information. For questions about this map app, please contact Susan Radke.
This map includes all current OUSD district-run and charter schools; and, Alameda County-authorized charter schools, as of June 24, 2015. For questions about this map, please contact Susan Radke.
The OUSD Web Map Center is now up and running at http://ousd.maps.arcgis.com/home/. The online Center hosts a collection of maps and apps that support administrative, planning, and research initiatives undertaken by the Research, Assessment & Data (RAD) department of the Oakland Unified School District. Current maps include:
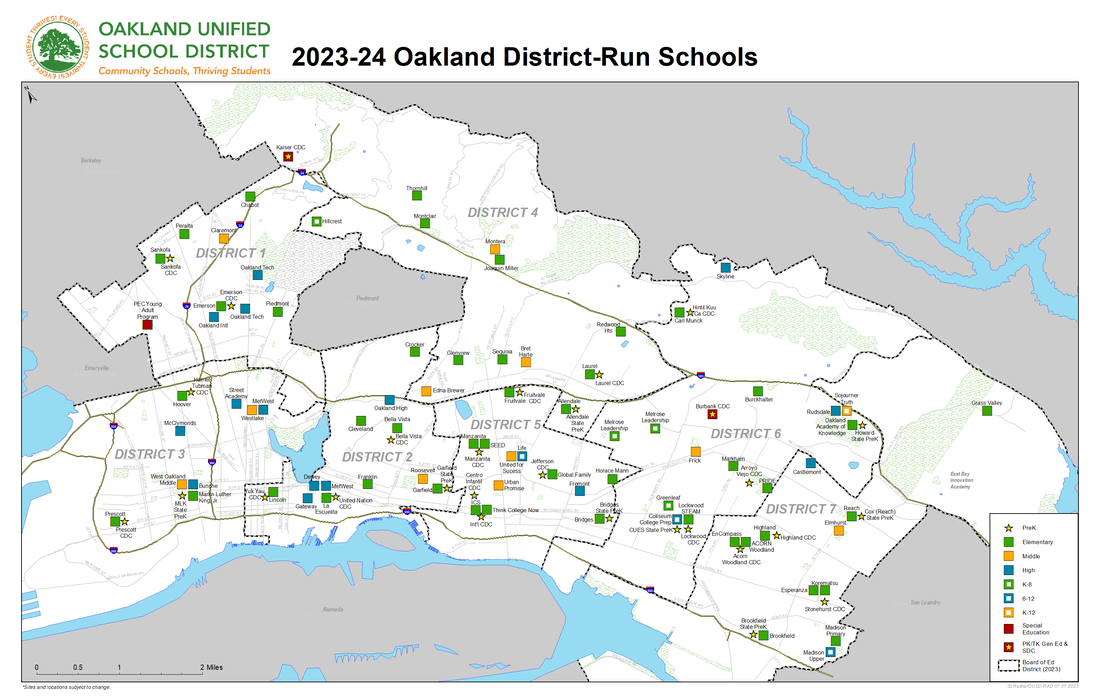
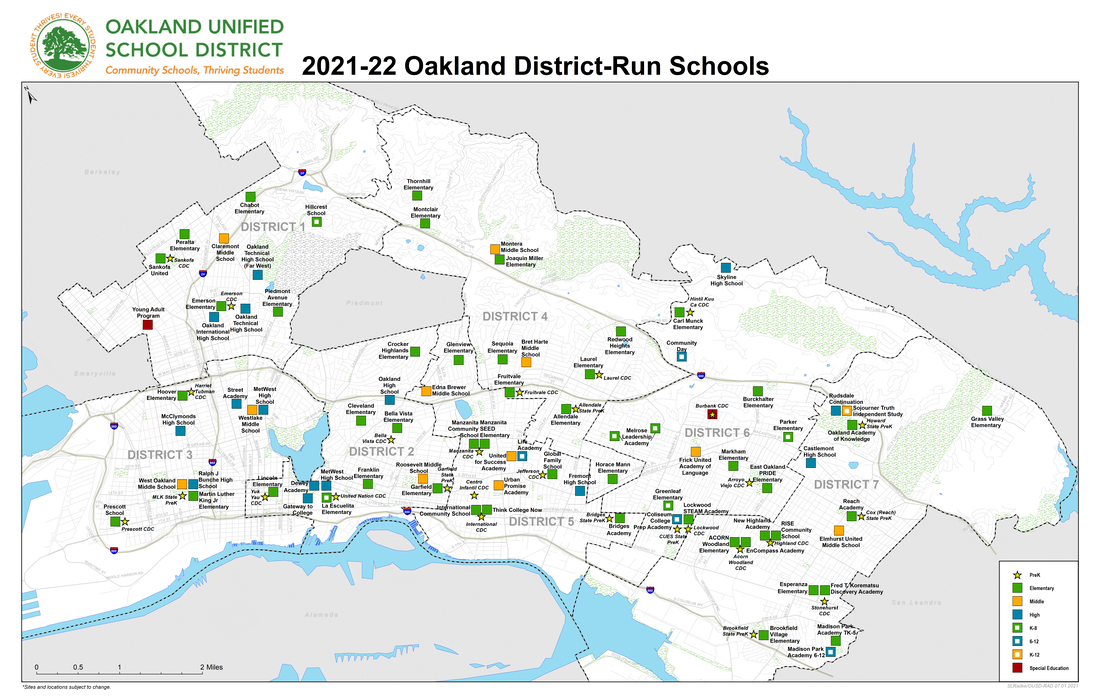
2014-15 school sites, attendance areas and district council boundaries Opportunity Mapping Environmental Factors School-Community Partnerships Live/Go 2014-15 TK programs and planning Asset Management/Programs Map The site is dynamic and the maps available will change as requests and applications are developed in support of OUSD planning and analysis. So, please check back periodically to see what new maps become available throughout the year. For questions about the OUSD Web Map Center, please contact Susan Radke. |
Archives
July 2024
Categories
All
|


 RSS Feed