Contact: Jay Tharp, Data Analyst, RAD, [email protected]
|
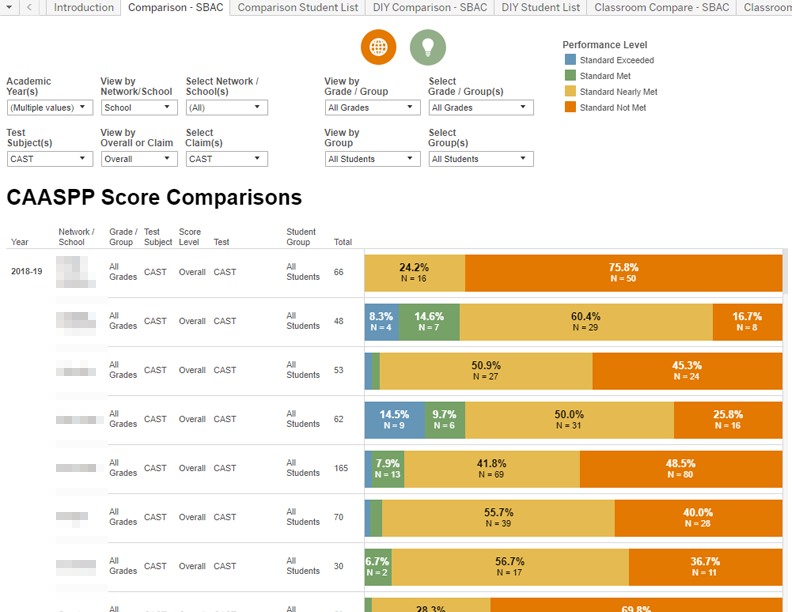
For OUSD Staff: SBAC performance dashboard now includes 2018-19 student scores from the California Science Test (CAST). CAST is taken by students when they are in 5th and 8th grades, and once during high school. This is the first year for CAST scoring. Scores are expressed as Performance Bands and as Scale Scores. (There is no DFS -- distance from standard -- score.)
Contact: Jay Tharp, Data Analyst, RAD, [email protected]
0 Comments
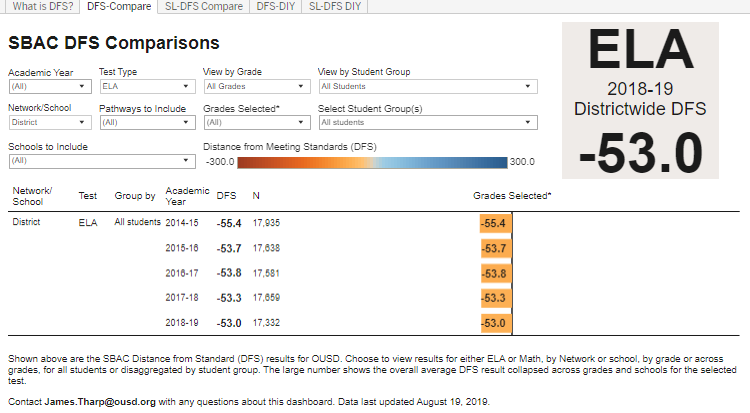
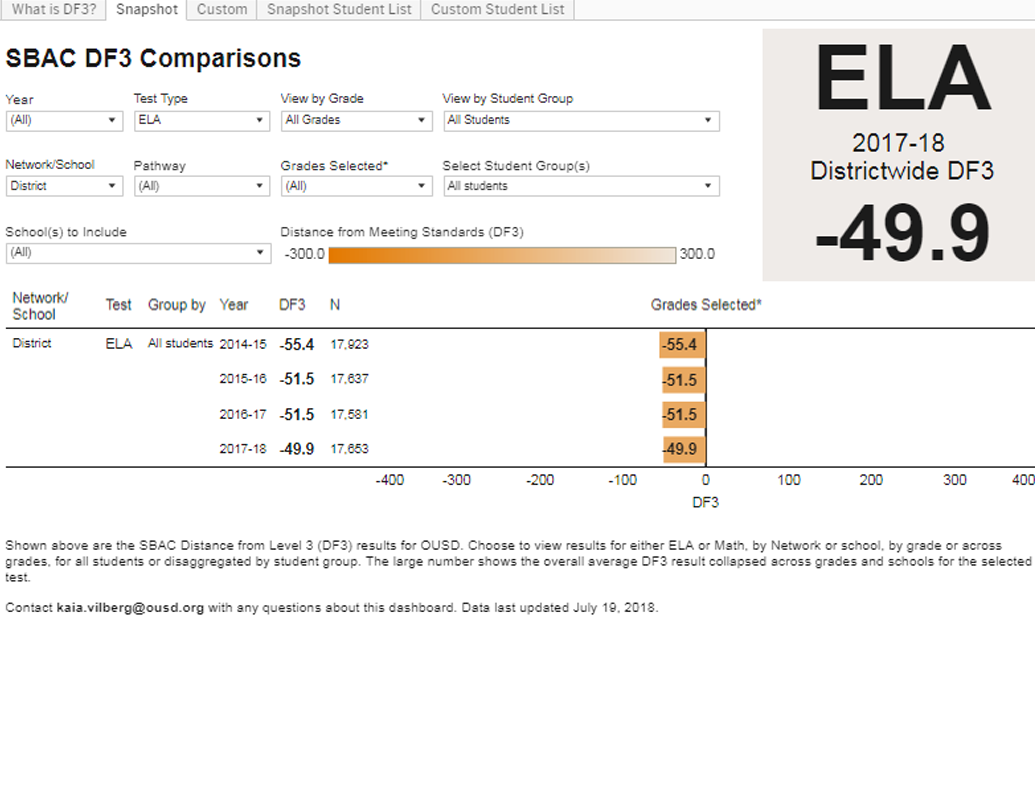
For OUSD Staff: The SBAC "DFS" Dashboard now contains the latest scores from Spring 2019 SBAC and four prior years. DFS (distance from standard) scores are a favorite for comparing results among grade levels and for measuring student progress. This dashboard includes a new "DIY" option for disaggregating the average DFS scores by up to four demographic dimensions. Contact: Jay Tharp, RAD, [email protected] For teachers and instructional teams:
Contact: Jay Tharp, Data Analyst II, RAD, [email protected] Kaia Vilberg, Statistician, RAD, [email protected]
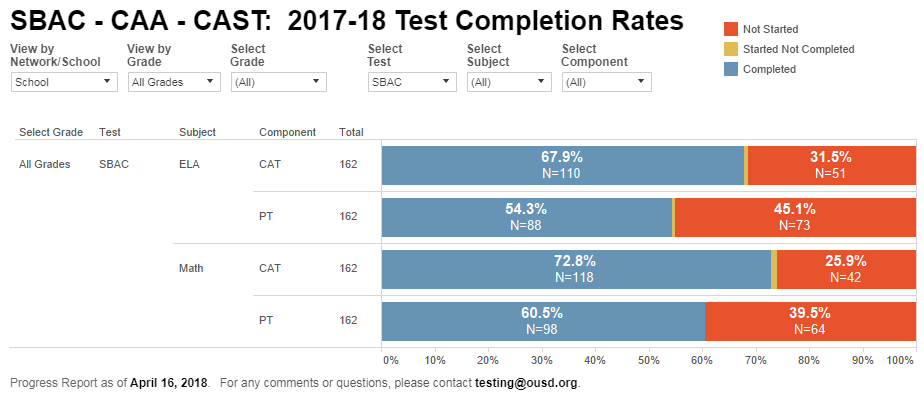
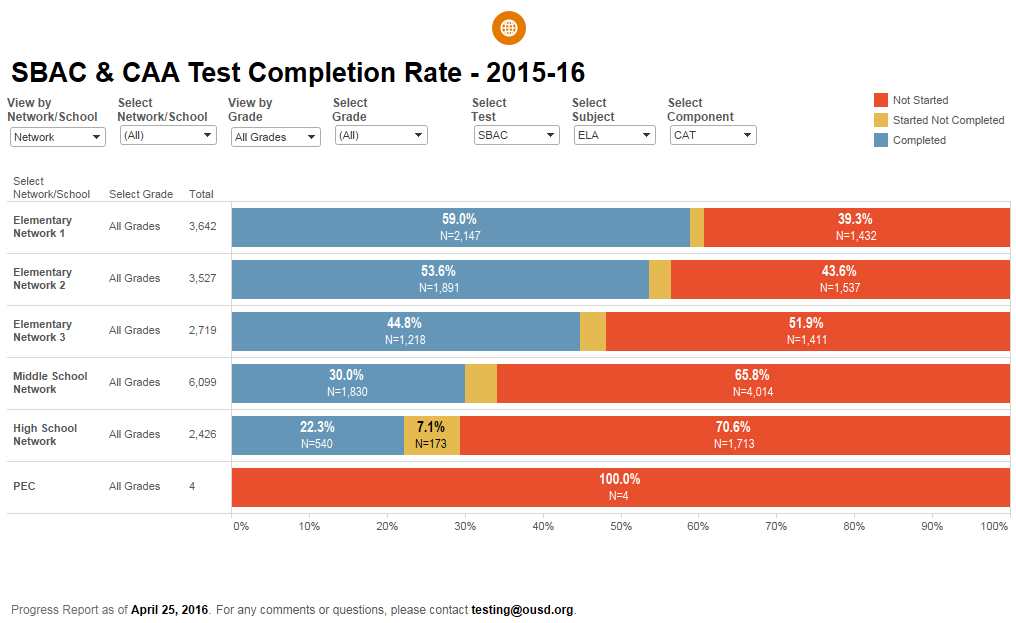
For OUSD Staff: Want to know if your site is meeting the 95% participation rate? Use this dashboard to track your SBAC, CAST, and CAA completion rates. Data is updated weekly every Monday throughout the testing window.
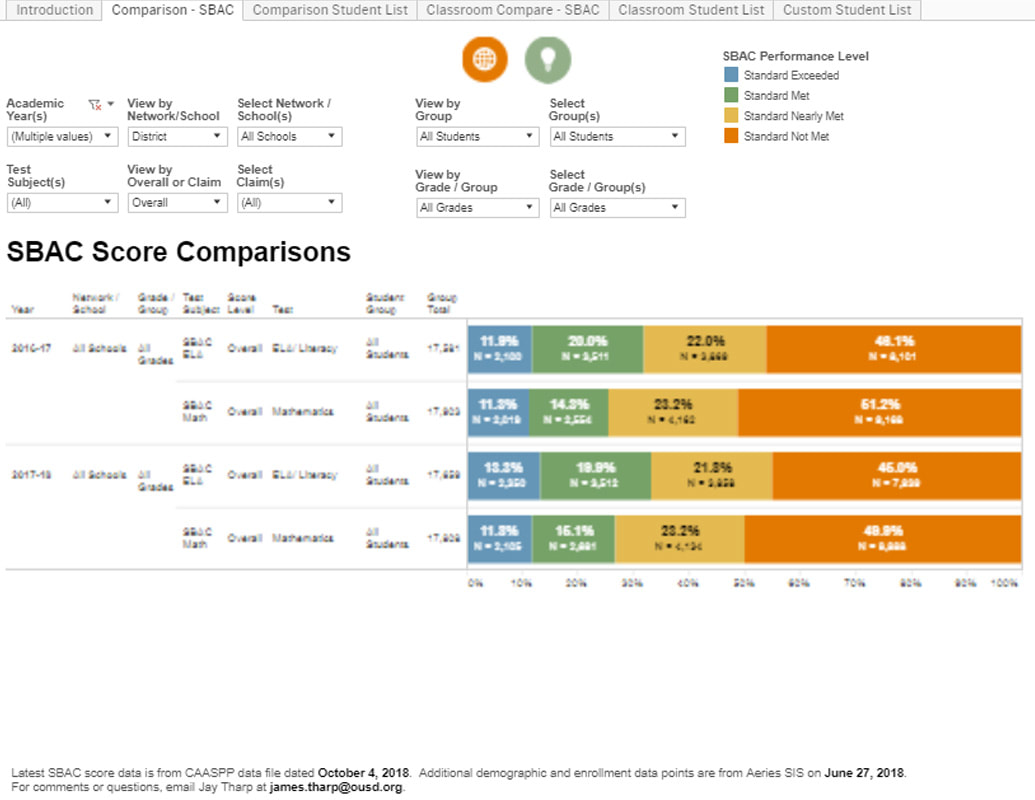
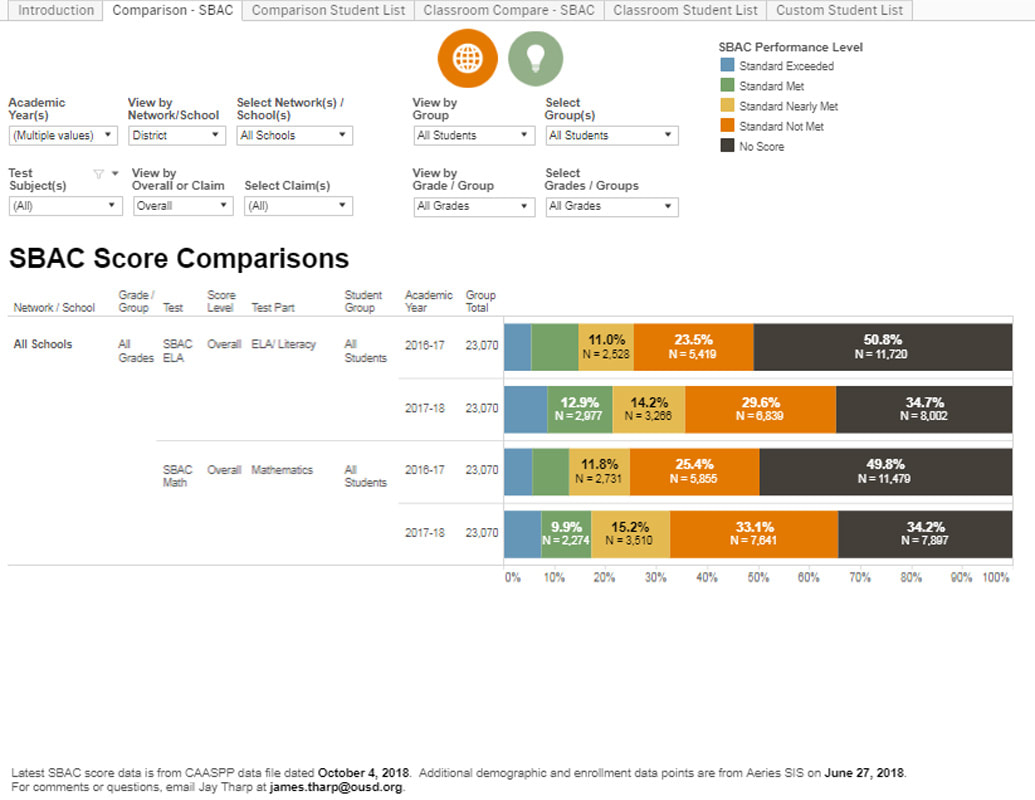
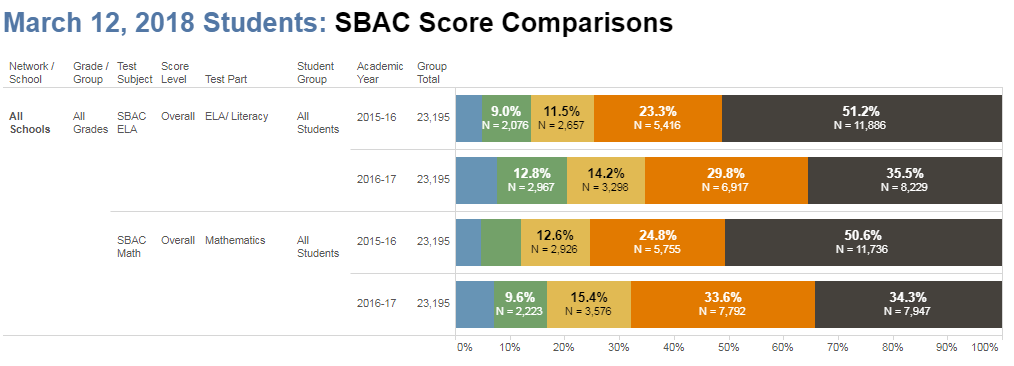
For questions, contact [email protected]. For OUSD Staff: The SBAC Operational dashboard provides SBAC Summative assessment scores for current students -- updated daily -- in grade 4 and above. Classroom-level comparisons are available; teachers and site leaders can drill down to student-level details.
For questions about the SBAC Operational dashboard, please contact: Jay Tharp, RAD, [email protected]. For OUSD Staff: Want to know if your site is meeting the 95% participation rate? Use this dashboard to track your SBAC and CAA completion rates. Data is updated weekly every Monday throughout the testing window.
For questions, contact [email protected]. |
Archives
July 2024
Categories
All
|

 RSS Feed