Contact Jay Tharp, RAD, [email protected].
|
A-G Completion Rates dashboard now has Class of 2019 data. 1121 OUSD graduates fulfilled the A-G breadth requirements for UC/CSU entry -- our highest number ever. The graduating class was also our largest -- 2090 scholars. These official statistics from the California Department of Education can be disaggregated by school or career pathway, and by key demographic variables. A version of this dashboard is available to the public.
Contact Jay Tharp, RAD, [email protected].
0 Comments
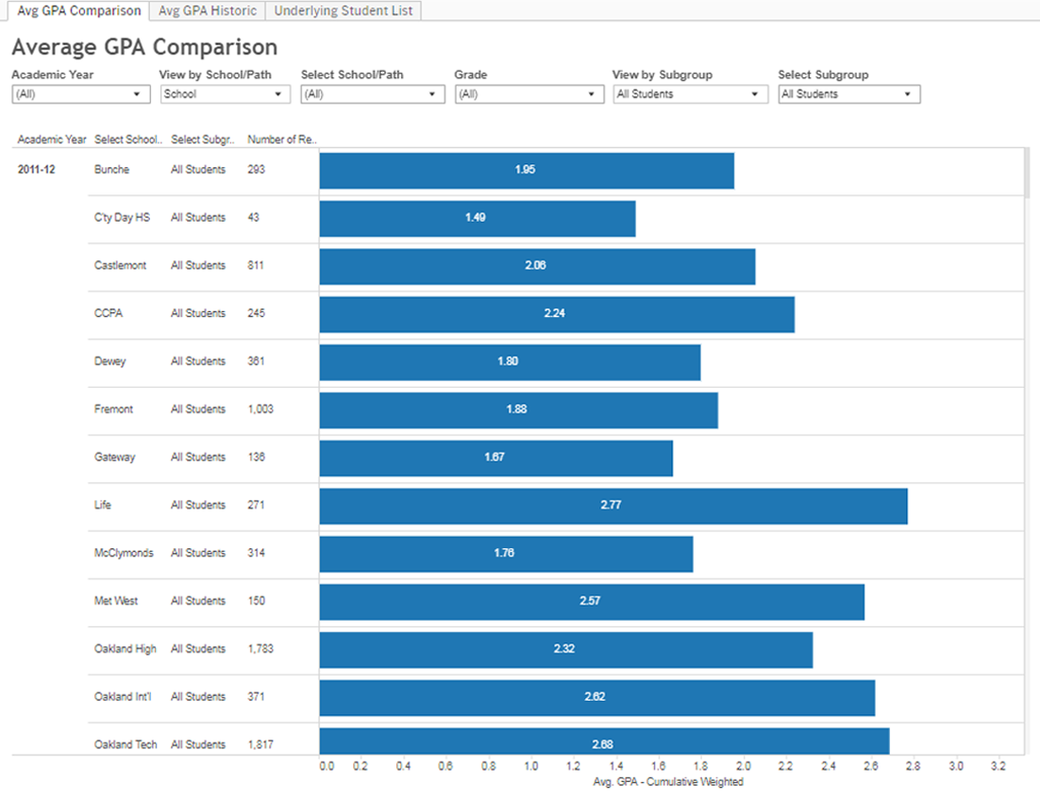
For OUSD Staff: New GPA dashboard now available! This dashboard allows users to view and compare average GPA by year, school, pathway, and subgroup. Additionally, the historical view shows GPA trends over time for the selected group.
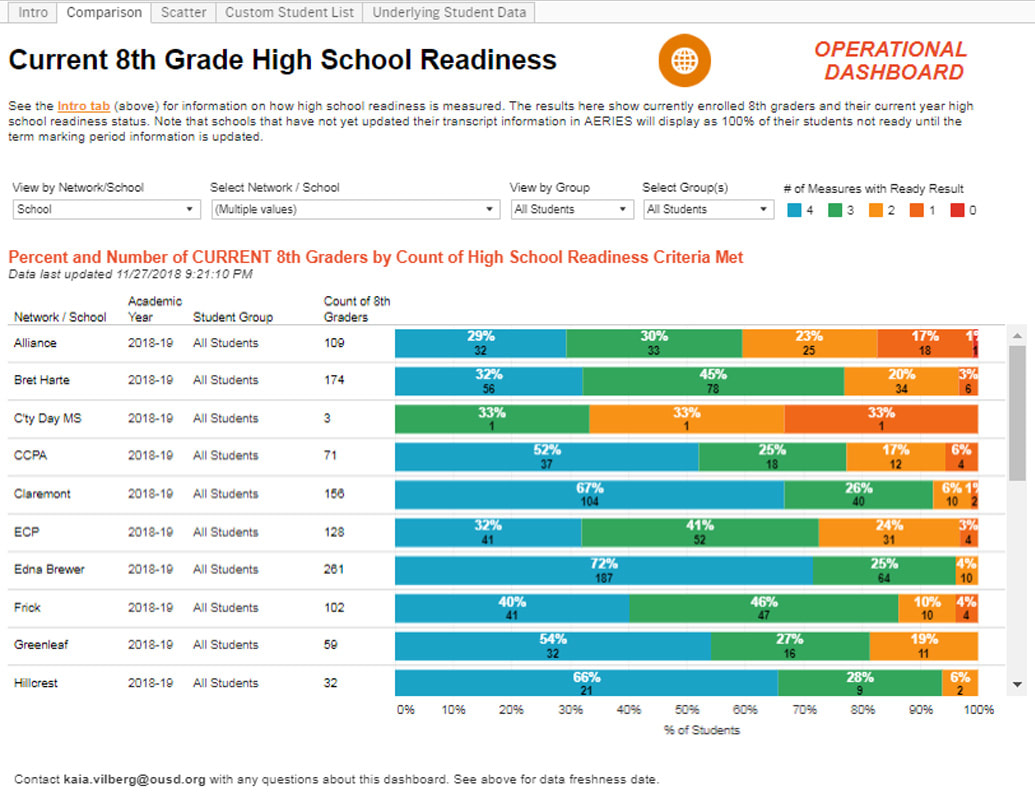
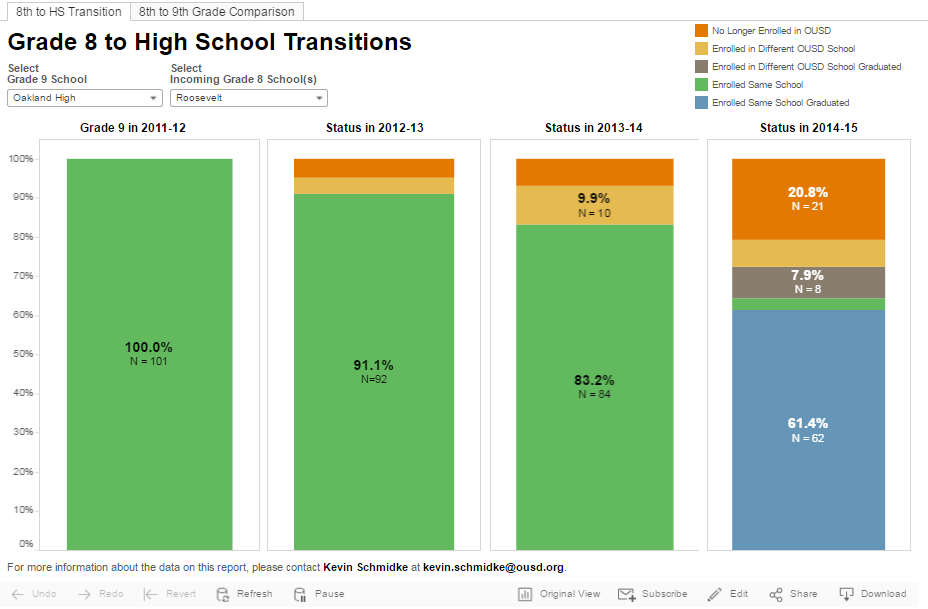
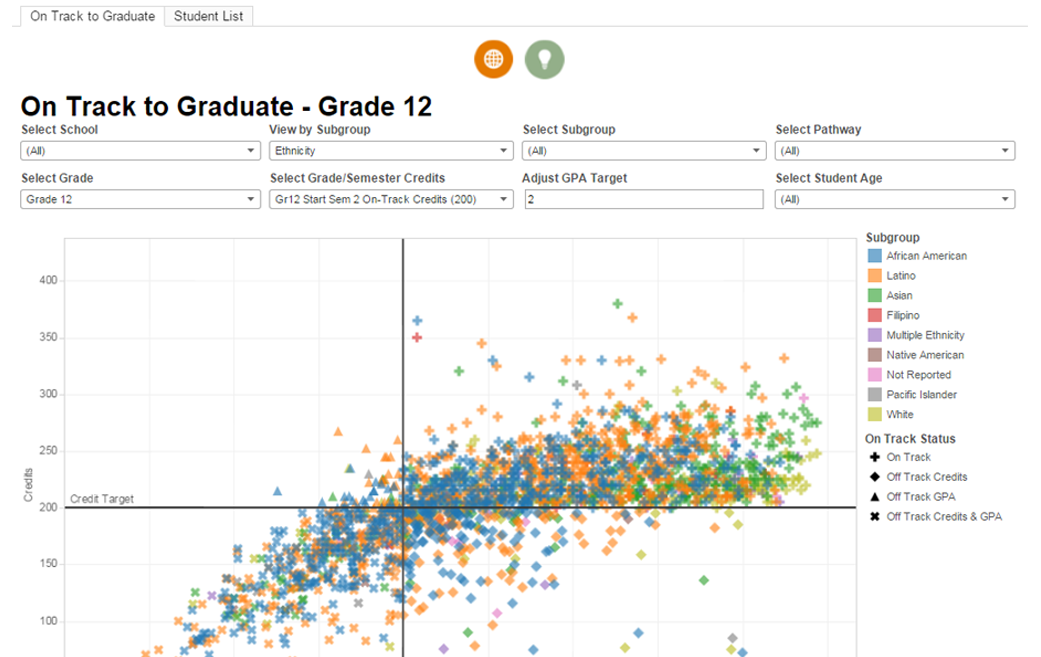
Contact: Kevin Schmidke, Data Analyst II, RAD, [email protected] For OUSD Staff: This High School Readiness for Current 8th Graders dashboard shows the high school readiness status for currently enrolled 8th graders. Custom student list enables users to filter by demographics, attendance, GPA, suspensions, grades in Math/English, and referrals. Data are updated nightly. Contact: Kaia Vilberg, Statistician, RAD, kaia.vilberg@ousd.org 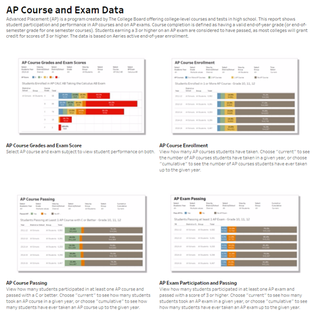 For OUSD Staff: The Advanced Placement (AP) Dashboard now available! This enhanced AP dashboard allows you to see AP course enrollment and performance as well as AP exam participation and performance data. The AP Course and Exam view allows you to select an AP course and Exam by subject in order to see performance for students who were enrolled in an AP course and took the corresponding AP exam. For questions about this dashboard, please contact Kevin Schmidke at [email protected]. For OUSD Staff: This report contains two dashboards that follows student transitions from 8th grade to high school. The first dashboard allows you to select a HS as well as an incoming middle school in order to see what happened to those middle school students as they progressed through HS. The second dashboard allows you to see academic performance, chronic absence, and suspension data in 8th and 9th grade for students who transition from a selected middle school (in 8th grade) to a selected HS (in 9th grade). For any additional questions about these dashboards, please contact Kevin Schmidke at [email protected]. For OUSD Staff: the On Track to Graduate dashboard has been updated to reflect GPA changes and credits earned after the first semester.The dashboard identifies high school students who are on-track to meet OUSD graduation requirement of 230 credits and a 2.0 GPA by the end of 12th grade. It also identifies students who are off-track for total credits earned, GPA, or both.
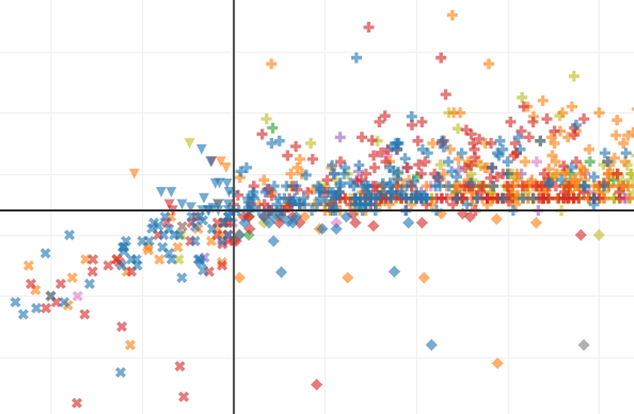
For questions about this dashboard, please contact Kevin Schmidke at kevin[email protected]. For OUSD staff: a new On Track to Graduation dashboard is now available. This dashboard is designed to identify students who are on track to meet the OUSD graduation requirement of 230 credits and a 2.0 GPA by the end of 12th grade. Alternately, the dashboard can be used to identify students who are off-track due to low credits, GPA, or both. Credit cutoffs for each grade level and semester are based on the assumption that a student will earn 30 credits per semester. Currently, the dashboard only accounts for total credits earned and not credits earned in individual subject areas.
For questions about this dashboard, please contact Kevin Schmidke at [email protected]. AP Exam Performance reports are now available on the Data Team’s Google Drive and include the past 5 years of data through 2013-14. These reports show the percent of students in grades 10-12 who have participated in at least 1 AP exam and additionally how many of those students passed the exam with a score of 3 or higher. Passing the AP exam with a score of 3 or higher indicates that a student is “qualified” to receive college credit. Reports are available in PDF format for individual schools and the district overall. Reports were not produced for schools with low participation.
For questions about this report, please contact Kevin Schmidke. 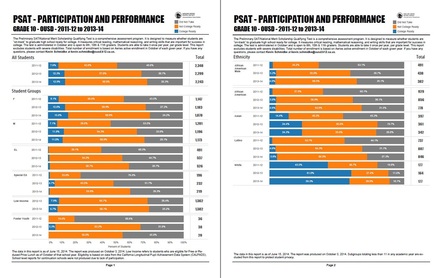 The 2013-14 PSAT results reports are now available on the Data Team’s Google Drive. The reports compare 2011-12, 2012-13 and 2013-14 grade 10 PSAT performance. The PSAT results are used as an early indicator of college readiness. Reports are available in PDF format for individual schools and the district overall. Reports were not produced for schools with low participation. For questions about this report, please contact Kevin Schmidke. The Early Assessment Program (EAP) results reports are now available on the Data Team’s Google Drive. The reports compare 2011-12, 2012-13 and 2013-14 grade 11 EAP performance in ELA and Math. The EAP results are used as an early indicator of college readiness.
Reports are available in PDF format for individual schools and OUSD. For questions about this report, please contact Kevin Schmidke. |
Archives
July 2024
Categories
All
|

 RSS Feed