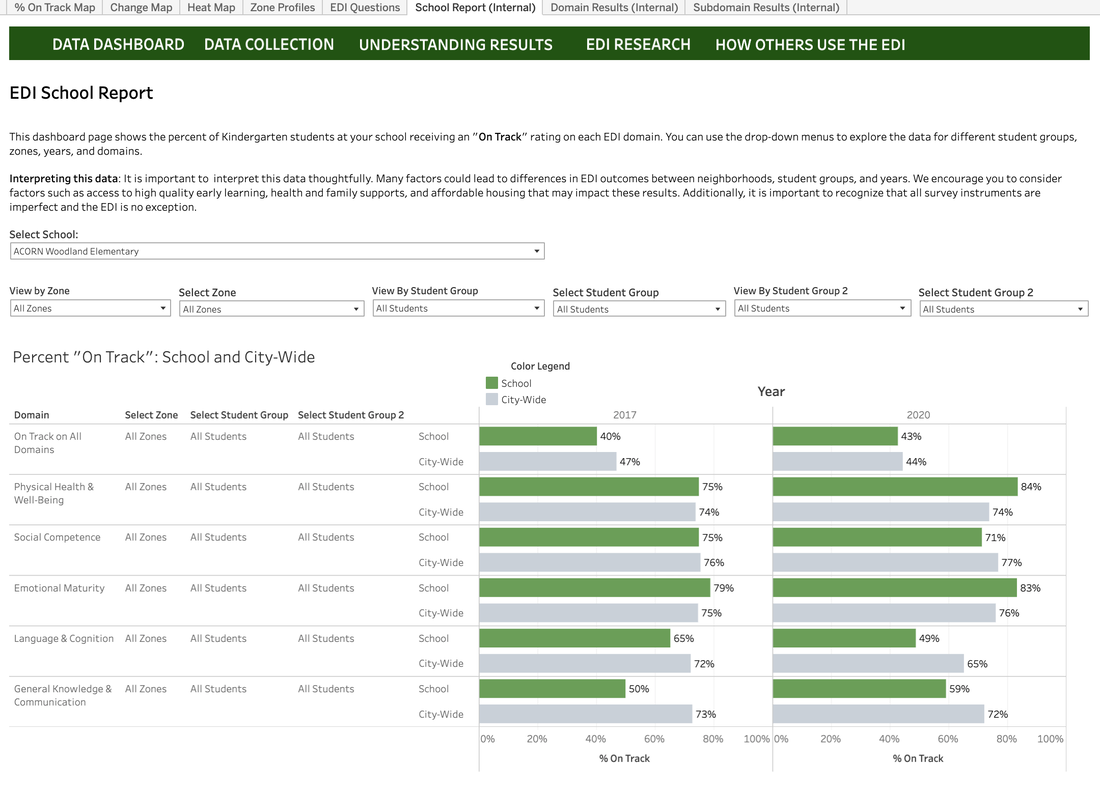
Department of Research, Assessment & Data
OUSD Data
  • Data
  • Resources
  • Requests
  • Announcements
  • About Us
    • Staff

McKinney-Vento Fact Sheets for 2019-20 School Year are now available.

9/10/2020

0 Comments

 
Picture
McKinney-Vento Fact Sheets for 2019-20 School Year are now available.
There are three pages highlighting students available:

Pg. 1 contains info for all unhoused McKinney-Vento eligible students
Pg. 2 contains info for all unhoused Non-Newcomer McKinney-Vento eligible students
Pg. 3 contains info for all unhoused Newcomer McKinney-Vento eligible students.

Contact: Christina McClain, Data Analyst, RAD, christina.mcclain@ousd.org
0 Comments

NEW! Attendance Interventions Dashboard

9/10/2020

0 Comments

 
Monitor which high-absence students have received an attendance intervention, when the latest took place, and those who still need one. Keep track of all attendance interventions each student has received and their attendance before and after each intervention date. Misha Karigaca says this Dashboard is a MUST for every attendance team!

Contact: Kevin Smith, RAD, kevin.smith@ousd.org ​
0 Comments

Updated Reports in Illuminate!

8/27/2020

0 Comments

 
Literacy Data Walls are ready for teachers, coaches, and principals on Illuminate! To view the reports just click on the orange tiles in Illuminate. These one-click reports allow users to see student assessment results from last year.

Grades 1-3 Data Wall contains students most recent SIPPS mastery test, F&P, letter name, letter sound, blending, segmenting and sight words
​

Grade 4 & 5 Data Wall shows students' midyear and fall F&P, SRI and IAB.
Click the Excel icon to export to Google Drive.

Contact: Rinat Fried, Research Associate, RAD, rinat.fried@ousd.org
0 Comments

NEW: Dashboards to support device and hotspot distribution, updated daily

8/20/2020

0 Comments

 
The Access to Tech Device and Internet Dashboard provides summary and student level data based on U1 field in Aeries.

The Tech Check Survey Completion Dashboard tracks # of students who have completed the Tech Check Survey.

The Tech Device Tracker Dashboard tracks the distribution of district computers and hotspots to our students. 

Contact: Juan Du, Executive Director, Research, Assessment and Data, Juan.Du@ousd.org
0 Comments

Enrollment Dashboard - For all leadership and staff

8/18/2020

0 Comments

 
Picture
Daily updated from Aeries, Enrollment dashboards for internal OUSD staff offer disaggregation by school, network, grade level, and a dozen demographic dimensions.  New demographic dimensions tracked for 2020-21:  EL_Year and EL_Year_Group (from Aeries LAC.YEL), and Newcomer (from Aeries LAC.U5).  A DIY (do-it-yourself) dashboard is available for your further exploration.

Contact: Jay Tharp, Data Analyst, Research, Assessment and Data, James.Tharp@ousd.org
0 Comments

NEW: Dashboards to support device and hotspot distribution, updated daily

8/13/2020

0 Comments

 
The Access to Tech Device and Internet Dashboard provides summary and student level data based on U1 field in Aeries.

The Tech Check Survey Completion Dashboard tracks # of students who have completed the Tech Check Survey.

The Tech Device Tracker Dashboard tracks the distribution of district computers and hotspots to our students. 

Contact: Juan Du, Executive Director, Research, Assessment and Data, Juan.Du@ousd.org
0 Comments

New Registration Data Confirmations Dashboards available!

8/3/2020

0 Comments

 
A new dashboard giving status on Registration Data Confirmations overall by district and school and for each student is now available.  Dashboards differentiate between students whose Confirmation Status is Confirmed, Partially Confirmed and Not Started. For each school and the district as a whole. Filters also available for Grade, Home Language and SDC (Special Day Class) Status. 
​

Contact: Kevin Smith, Data Analyst II, RAD, Kevin.Smith@ousd.org
0 Comments

UPDATED CSDR NOW AVAILABLE!

6/22/2020

0 Comments

 
For Principals and Site Leaders - CSDR -- Comprehensive Student Data Roster -- RAD's student-level "database in a spreadsheet" was updated on Monday, June 21, with final EOY/Spring Semester grades, attendance and suspension data. Several assessments were of course cancelled due to school closures.

CSDR is also now available for your Fall 2020 "Rising-6th" or "Rising-9th" students. CSDR is updated six times per year in the standard school-wide edition and in a broken-down-by-Teacher edition.  
Available by request from RAD Student Data Requests and Consultations.

Contact: Juan Du, Director of Analytics, Juan.Du@ousd.org
0 Comments

UPdated CSDR Now Available!

3/9/2020

0 Comments

 
For Principals and Site Leaders - CSDR -- Comprehensive Student Data Roster -- RAD's student-level "database in a spreadsheet" was updated on Monday, March 9, with secondary Spring Marking Period 1 course grades, YTD attendance and YTD suspension data.

Mid-Year (Winter) scores are included for: reading assessment scores from F&P, DRA, Reading Inventory and SBAC Interim IABs, plus math assessment scores from IABs and Math Inventory.
Details about the 100+ data points included in CSDR.  

CSDR is updated six times per year in a schoolwide edition and in a broken-down-by-Teacher edition.
It is available by request from  RAD Student Data Requests and Consultations.
Contact: Juan Du, Director of Analytics, Juan.Du@ousd.org
0 Comments

A-G Completion Rates dashboard now has Class of 2019 data

2/18/2020

0 Comments

 
A-G Completion Rates dashboard now has Class of 2019 data. 1121 OUSD graduates fulfilled the A-G breadth requirements for UC/CSU entry -- our highest number ever.  The graduating class was also our largest -- 2090 scholars.  These official statistics from the California Department of Education can be disaggregated by school or career pathway, and by key demographic variables. A version of this dashboard is available to the public.

Contact Jay Tharp, RAD, james.tharp@ousd.org. 
0 Comments

Final Update to Fast Facts 2019-20

2/11/2020

0 Comments

 
Picture
Final updates to Fast Facts 2019-20 are now available. Fast Facts was designed to give you quick access to basic numbers and information on OUSD. What is our total enrollment? What is our total number of schools? What percentage of our student population is eligible for free or reduced price lunch? All these answers and more can be found on our infographic.

​For questions about this infographic, please contact Rattana Yeang at rattana.yeang@ousd.org
0 Comments

​Disproportionality Dashboard Updated

2/6/2020

0 Comments

 
Picture
For OUSD Staff: The Disproportionality Dashboard has been updated to include calculations from the
beginning of the school year through December 20, 2019.

​Contact: Christina McClain, Data Analyst II, RAD, christina.mcclain@ousd.org
0 Comments

FOSS Participation Dashboard

1/30/2020

0 Comments

 
Picture
For OUSD Staff: Participation rates from the Fall implementation are based on fully scored assessments results only. Anyone with OUSD email account can access the report here.

Contact: Rattana Yeang, Data Analyst II, RAD, rattana.yeang@ousd.org
0 Comments

Tardy Student Data

1/30/2020

0 Comments

 
For OUSD Staff: The Period Attendance Dashboards have added to the Tardy Snapshot Dashboard a list of students who have been tardy 25% or more of their attended classes. Ranked in descending order per % of classes tardy and filterable by schedule, date, and demographic data elements.
​
Contact: Kevin Smith, Data Analyst II, RAD, kevin.smith@ousd.org
0 Comments

SBAC Performance Dashboard Now Includes 2018-19 Student Scores from the California Science Test (CAST)

1/23/2020

0 Comments

 
Picture
For OUSD Staff: SBAC performance dashboard now includes 2018-19 student scores from the California Science Test (CAST). CAST is taken by students when they are in 5th and 8th grades, and once during high school. This is the first year for CAST scoring. Scores are expressed as Performance Bands and as Scale Scores. (There is no DFS -- distance from standard -- score.)

Contact: Jay Tharp, Data Analyst, RAD, james.tharp@ousd.org
0 Comments

Three New Dashboards for Foundational Skills and Sight Words

1/23/2020

0 Comments

 
Picture
Picture
Picture
​For OUSD Staff: Three New Dashboards for Foundational Skills and Sight Words. Visit the teacher portal for three new item-level dashboards covering early literacy skills and sight words. Class Grid gives teachers a visual red-green overview of which letter names, letter sounds and sight words each of their students has and has not mastered. Student Profile provides a one-pager for each student with their testing history on each of the foundational skills. This is a great one to share with parents at parent-teacher conferences. Skills & Sight Words Student Groups generates a list of students in each class who has not yet mastered a letter name, letter sound, or sight word for easy grouping.
​
Contact: Rinat Fried, Data Analyst, RAD, rinat.fried@ousd.org
0 Comments

Updated CSDR Now Available!

1/21/2020

0 Comments

 
For Principals and Site Leaders - CSDR -- Comprehensive Student Data Roster -- RAD's student-level "database in a spreadsheet" was updated on Friday, January 17, with fresh course grade, attendance and suspension data points from the Fall semester.

Mid-Year (Winter) IAB scores for secondary grade levels are now included. Details about the 100+ data points included in CSDR.  

CSDR is updated six times per year in a schoolwide edition and in a broken-down-by-Teacher edition.
It is available by request from  RAD Student Data Requests and Consultations.
Contact: Juan Du, Director of Analytics, Juan.Du@ousd.org
0 Comments

All Staff Dashboard Now Available!

1/13/2020

0 Comments

 
Picture
The 2019-20 All Staff Dashboard allows viewing of aggregated data for all staff, with the ability to filter by department/site, job type, union, and more. It replaces the Teacher Data Dashboards released in previous years. A public version is now available here and a version for internal authorized users is available here. Internal authorized users can create custom staff lists that include OUSD email, as well as research credentials, teaching assignments, and due for evaluation status for OEA members. Data comes directly from Escape and updates nightly.

Contact: Laura Augustus, Reporting Specialist, Human Capital Reporting, RAD, laura.augustus@ousd.org
0 Comments

Updated Staff Retention Data

1/10/2020

0 Comments

 
Picture
The Staff Retention Dashboard now includes the most recent year of retention data. This dashboard displays quantitative analyses of retention of different staff groups.  There are three district wide analyses: retention by bargaining unit, retention of school leaders, and retention of teachers.  There is also a deeper dive analysis into teacher retention at school sites as well as teacher retention by demographics (race, gender, age).  

Contact: Jeanette Wickelgren, Manager, Human Capital Strategic Initiatives, RAD, jeanette.wickelgren@ousd.org

​
0 Comments

ELL Progress Monitoring Dashboard - With Initial ELPAC Data for Students Tested INSIDE ousd & Summative ELPAC data for Students Tested OUTSIDE OUSD.

12/11/2019

0 Comments

 
Picture
For OUSD Staff: Initial ELPAC data is now included in our progress monitoring dashboard and is updated weekly. Summative ELPAC data for students tested outside of OUSD is updated once a month. Aggregate level data is accessible to anyone with an OUSD username (first.last) and password. Student level data is open to Central Office and School Leadership. Looking for something more teacher focused? Check out our new Distance From Criteria (DFC) dashboard and Scatter Plot designed specifically for teachers. Note: Load times for Central Office staff using the DFC dashboard will be slow.

Contact: Rattana Yeang, Data Analyst, RAD, rattana.yeang@ousd.org
0 Comments
<<Previous
Forward>>

    Archives

    May 2022
    January 2022
    June 2021
    May 2021
    April 2021
    March 2021
    February 2021
    January 2021
    December 2020
    November 2020
    October 2020
    September 2020
    August 2020
    June 2020
    March 2020
    February 2020
    January 2020
    December 2019
    November 2019
    October 2019
    September 2019
    August 2019
    May 2019
    April 2019
    March 2019
    February 2019
    January 2019
    December 2018
    November 2018
    October 2018
    September 2018
    August 2018
    July 2018
    June 2018
    May 2018
    April 2018
    March 2018
    February 2018
    January 2018
    December 2017
    November 2017
    October 2017
    September 2017
    August 2017
    July 2017
    May 2017
    April 2017
    March 2017
    February 2017
    December 2016
    November 2016
    October 2016
    September 2016
    August 2016
    June 2016
    May 2016
    April 2016
    March 2016
    February 2016
    January 2016
    December 2015
    October 2015
    September 2015
    August 2015
    July 2015
    June 2015
    May 2015
    April 2015
    March 2015
    February 2015
    January 2015
    December 2014
    October 2014
    September 2014
    August 2014

    Categories

    All
    Accountability
    Advance Placement
    Asset Management
    Attendance
    CAASPP
    Calendar
    California Healthy Kids Survey
    CHKS
    Chronic Absence
    College
    CORE
    CSDR
    CST CMA
    DIBELS
    Disproportionality
    Dropout
    EAP
    Early Development Instrument
    Early Literacy
    Early Warning
    EDI
    English Language Learner
    Enrollment
    F&P
    GPA
    Graduation
    Guides
    High School
    IAB
    Infographic
    I-Ready
    Linked Learning
    Maps
    Math
    McKinney-Vento
    Multilingual
    Newcomer
    Newsletter
    Office Referral
    Partnerships
    Pathway
    Physical Fitness Test
    Post Secondary Readiness
    Preschool
    Programs
    PSAT
    Public
    SBAC
    Scholastic Math Inventory
    Scholastic Reading Inventory
    Science
    Staff Data
    State Testing
    Student Level
    Summer
    Survey
    Suspension
    Technology
    Weekly Engagement Report

    RSS Feed